List of the Top 7 Total Quality Management Tools: Pareto Charts, Scatter Plots, Flow Charts, and More
The goal of Total Quality Management is to reduce the incidence of errors within manufacturing and/or service processes. By doing this, companies will be able to effectively streamline any changes by updating equipment and having fully trained employees. And, in turn, customers will be more satisfied. But, companies cannot institute Total Quality Management without using the right tools. So, here we discuss some of the top Total Quality Management (TQM) tools available.
Pareto Principle
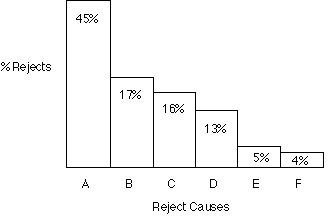
The first tool to be discussed is the Pareto Principle. This principle effectively states that the majority of errors come from only a handful of causes. Or, in ratio terms, 80 percent of the problems are linked to 20 percent of the causes. So, the point of this tool is to focus on that 20 percent that causes the problems.
The Pareto Principle allows managers to strictly deal with the 20 percent that is causing the problem, which generally includes machine or operator error. Fixing these errors will solve 80 percent of the issues as opposed to trying to focus on everything. The before and after results can be plotted on a Pareto Chart to see if the solution worked.
Control Charts and Flow Charts
The next tool is a control chart. Data is historically plotted to see how processes have changed over time. Control charts have a central line for the average, and an upper and lower line that represents the upper and lower control limit respectively. The goal is to have all of the processes tightly plotted along the center line. If processes data points are all over the place, then the processes are statistically out of control.
Flow charts can also assist with TQM since they allow managers to see how well processes are flowing. This is done via pictures, words, etc., with arrows pointing to the next data flow point. These data flow points include objectives, problems, solutions, etc.
Scatter Plots and Diagrams
Scatter plots are another TQM tool. Basically, scatter plots look like a line graph without the line. The point of data points in scatter plots is to show how one data point positively or negatively correlates to another data point. If the data comes close to creating a straight line, then the greater the possibility that one point correlates to the next. Since you want a previous decision to help move the
process forward, managers want the data to coordinate positively and create a straight line.
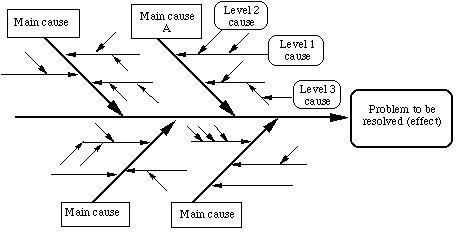
Diagrams can also be used to analyze process distribution. This can be done with cause and effect diagrams which show how a main cause and lesser causes can affect a problem. The desired effect would be that the problem becomes resolved. But, the diagram will show that either way.
Check Sheets and Check Lists
Check Sheets and Check Lists are the final major TQM tools. Check Sheets are forms that gather data and allow users to easily analyze and interpret that data. The Check Sheet, however, is only meant to gather one type of data at a time so these are really only good for data that’s going to repeat often.
Check Lists, on the other hand, are meant to deal with a specific problem. These allow managers to check and see if all necessary steps have been done. While Check Lists are similar to Check Sheets, they are used to assist with the process operations and not the gathering of data.