The Pareto Principle (80/20 Rule) Explained with Charts, Graphs, and Examples
The Origins of the Pareto Principle
Vilfredo Pareto (1848-1923) might not be a household name, but his accomplishments and observations form the basis of a number of theories in a wide variety of fields from economics to philosophy. One of his most famous observations forms the basis for the Pareto Principle, also known as the 80/20 Rule. This principle basically states that 80% of the “outcomes” come from 20% of the “inputs.” However, I use the terms “inputs” and “outcomes” quite loosely here, because the principle is more far-reaching than that.
As the story goes, the origins of the 80/20 rule date back to 1906 when Pareto observed that 80% of the property in Italy was owned by 20% of the population.(1) It should be noted that it was actually Joseph M. Juran who later generalized and named this rule(2), and thus, Juran should be credited with the principle’s popularity and widespread use.
But What Does the Pareto Principle Really Mean?
It’s important to note that the Pareto Principle is really a rough generalization that a large majority of X is really caused by a relatively small minority of Y. That is, although the principle is referred to as the 80/20 rule, the numbers 80 and 20 are not written in stone. As an example, when used in Six Sigma quality control processes, the 80/20 rule is really suggesting that a large improvement in quality can be made by focusing on those problems that are causing the most defects. That is, when all is tallied up and analyzed, there could be 30 possible causes for a product defect. However, further analysis may show that 6 of these causes (or 20%) are responsible for over 80% of the defects. So, you would get more bang for your buck by focusing on those 6 causes rather than all 30.
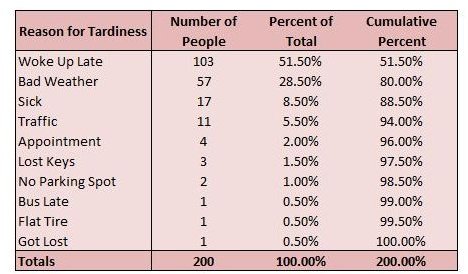
Let’s look at another example that illustrates the Pareto Principle. Suppose a poll was taken of 200 people who were late for work, and they were asked to explain why they were late. The chart below shows the responses to this poll. (Click any image for a larger view.)
In this poll, there were ten different reasons given for being late for work. But, note that many of these reasons were only claimed by one or two people. The vast majority of the respondents gave “Woke Up Late” or “Bad Weather” as their excuse. We can use Excel to create a Pareto chart of this information and get the graph shown below.
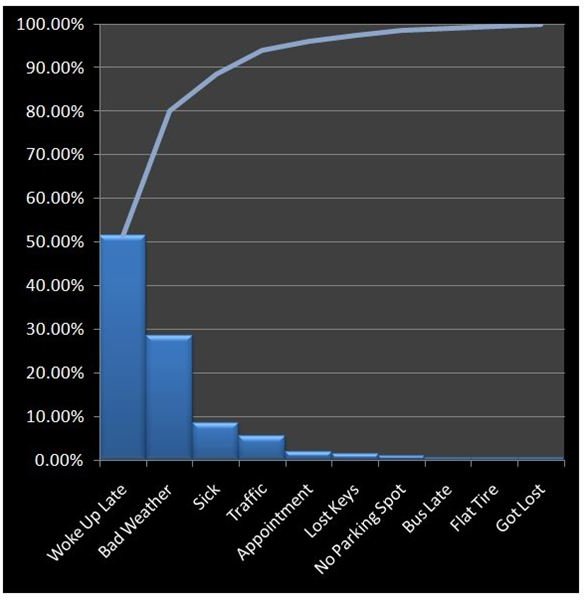
In this example, we can see that 80% of the reasons for being late came from two excuses (or 20% of the total number of excuses).
Other Examples of the 80/20 Rule
The Pareto Principle seems to rear its head in several other examples. For instance, if you’re a manager, 80% of your section’s errors may come from 20% of your employees. If you’re a teacher, you may spend 80% of your time trying to help 20% of your students. And, when planning your monthly budget, 80% of your money may go to pay about 20% of your bills – especially if you’re single and your biggest expenses are rent and your car payment.
And, as Pareto originally observed, it’s not uncommon for 80% or more of the wealth to belong to 20% or less of the population of any specific locale.
References and Additional Resources
1. “Vilfredo Pareto.” Wikipedia.
2. Bunkley, Nick. “Joseph Juran, 103, Pioneer in Quality Control, Dies.” New York Times.