Using Different Project Management Control Tools to Keep Your Project Running Smoothly
Control Chart
The control phase of project management occurs after the project has been finished and released to the Process Owner. Throughout the project, improvements were made to make the entire process work more efficiently. The control phase ensures that these improvements are preserved and used in future projects. There are some tools that are used during the control phase to make sure that the project continues to run smoothly.
The first tool is the control chart. The control chart is actually a graph that pinpoints the changes that have been made throughout the project. Changes are plotted on the graph historically with the date. The chart will have three lines. The main, center line will be the average line. The lower line will be for the lower-end of the control limit, and the upper line for the upper-end. These lines are created by the change data.
Basically, project managers and teams can look at these lines and compare it to the current data. These charts will help teams determine whether or not their processes are in control with consistent variation or whether or not their processes are out of control. The average line on the control chart is where most of the points cluster while the control range is how near together the points are. If points are not clustered or are not very tightly clustered, the process may be erratic.
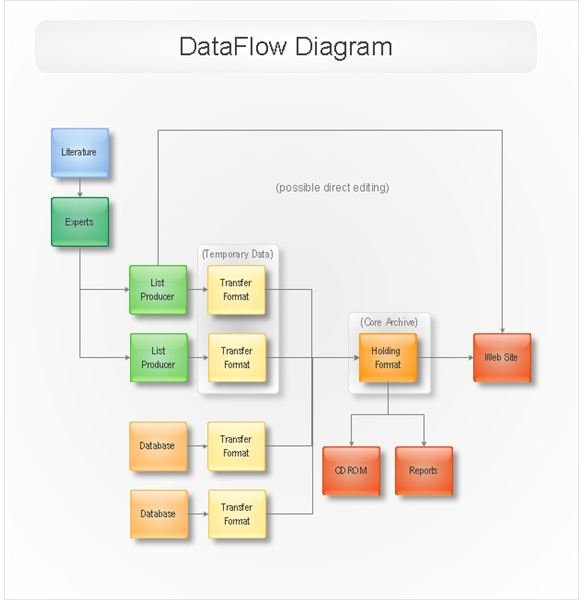
Flow Diagram
Another tool used in the control phase is the flow diagram. The flow diagrams show how the parts of each process or task flowed throughout the project. It shows the step-by-step processes that led to the solution or project completion. Flow diagrams have a dual purpose. They can assist in explaining how the overall process works, but they can also be used to determine how well that process worked.
The flow diagram allows project managers and teams to basically layout the entire process. The importance of this is that teams can then see what areas did not flow very well or where processes/tasks can be improved in the future. This allows teams to see each step in the process as opposed to just looking at the end product.
Quality Control Process Chart and Standardization
The next component of the control phase is the quality control process chart. This chart basically encourages project managers to find areas that need to be changed, plan for that change, experiment with the new process before implementation, check to see if the change worked and act on what was learned from that change. The quality control process chart will map this all out for teams. If the new direction worked, teams can apply this change to other processes. If not, they can go through the whole process again until they find a change that actually works.
The final control phase tool is standardization. Standardization basically means that everyone performs their tasks efficiently and the same way over time. Generally, if the process is working correctly, don’t change it unless there is proof that a different method will work. Until that does arise, train the teams to follow a set procedure that they must stick to throughout the project.