How to Create a Decision Tree: Steps Involved
Elements of Creating a Decision Tree
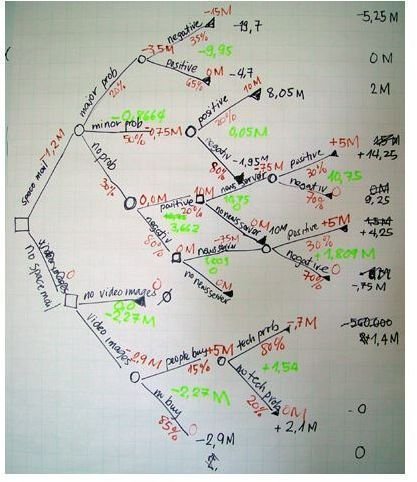
A decision tree starts from one end of the sheet of paper or the computer document, usually the left-hand side. The starting point extends in a series of branches or forks, each representing a decision, and it may continue to expand into sub branches, until it generates two or more results or nodes. The tree expands or grows until at least one branch leads to a decision node or a chance node.
The nodes of a decision tree are:
- Decision node: Decision nodes, conventionally represented by squares, represent an outcome defined by the user. The attribute undergoes some test or evaluation at this node, and each possible outcome of such evaluation generates a branch and a sub-tree.
- Leaf node: Leaf nodes indicate the value of the target attribute
- Chance node: Chance nodes, conventionally represented by circles, represent uncertain outcomes under the mercy of external forces
- End node: End nodes, conventionally represented by triangles, represent the end of the path.
Once you learn how to create a decision tree, you will realize it is not that difficult a task.
Image Credit: Wikimedia Commons
How to Draw a Decision Tree
People generally draw decision trees on paper. Many computer applications nevertheless exist to aid this process. Some applications even generate decision trees automatically by feeding the algorithm.
How do you draw a decision tree? The steps to create a decision tree diagram manually are:
- Take a large sheet of paper. The more options there are, and the more complex the decision, the larger the sheet of paper required will be.
- As a starting point for the decision tree, draw a small square around the center of the left side of the paper. If the description is too large to fit the square, use legends by including a number in the tree and referencing the number to the description either at the bottom of the page or in another page
- Draw out lines (forks) to the right of the square box. Draw one line each for each possible solution to the issue, and describe the solution along the line. Keep the lines as far apart as possible to expand the tree later.
- Illustrate the results or the outcomes of the solution at the end of each line. If the outcome is uncertain, draw a circle (chance node). If the outcome leads to another issue, draw a square (decision node). If the issue is resolved with the solution, draw a triangle (end node). Describe the outcome above the square or circle, or use legends, as appropriate.
- Repeat steps 2 through 4 for each new square at the end of the solution lines, and so on until there are no more squares, and all lines have either a circle or blank ending.
- The circles that represent uncertainty remain as they are. A good practice is to assign a probability value, or the chance of such an outcome happening.
Since it is difficult to predict at onset the number of lines and sub-lines each solution generates, the decision tree might require one or more redraws, owing to paucity of space to illustrate or represent options and or sub options at certain spaces..
It is a good idea to challenge and review all squares and circles for possible overlooked solutions before finalizing the draft.
Evaluation
Using the decision tree diagram to evaluate the best decision among the various options can take many forms, depending on the purpose of the tree.
One basic and simple option is to assign a cash value or score to each possible outcome, by estimating the worth or value generated if the specific outcome comes to pass, and selecting the outcome that scores the most. For circles or chance nodes that have uncertain results, multiply the value by the probability percentage. For instance, if the value is $1000 and the probability of happening is 50 percent, the value for that chance node is $500.
Decision trees are simple tools that make all possible options or decisions to an issue explicit.