Planning Agile Projects using MS Excel

A project plan should address several aspects of a team activity, but keeping in mind different audiences. It is not just a plan, showing what you are going to do, who is involved, and by when it will be done. Scope, capacity, and schedule translate to the costs and are probably the most important aspects of any plan. Once you are through discussing these aspects, the stakeholders are surely going to want to know how you will track and monitor, what are the governance mechanisms, how will you report the progress, highlight the risks, identify and implement mitigations.
A plan should include graphs that display where you are in the project, what is completed and how much is left. The plan should also take into account, if you proceed at the current velocity, when are you likely to finish, and what do you need to do to achieve the velocity necessary in order to complete the project on time. All this and much more can be accomplished by our normal day-to-day tool that we use called MS Excel.
The feature I like most in Excel is Tabs. Tabs allow me to tell a story by naming them appropriately and ordering them wisely. In addition I like to create a summary tab that either links to all the other tabs, and/or summarizes the information the details found in the other tabs of the worksheet. I have come across many professionals, most of them highly technical who never use the tabs and use only the first sheet that the application opens to. Sheet1 and that’s it! Then there will be other excel files and MS Word documents that you have to refer to, to get the complete picture. For the audience, this can be quite tedious and disorganized to say the least. Figure 1 (below) is a snapshot of an example of how much I rely on tabs.
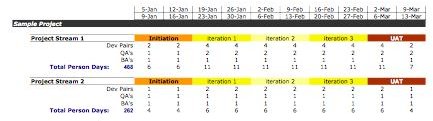
In a project management plan, there should be one sheet dedicated to the schedule for the different streams of work. I achieve a visual for this by simply highlighting the cells under the timeline by filling them with color - the color codes being different for different activities such as development, UAT, initiation, etc. The timeline is typically weeks per column for me as I work with iterations. Even if we follow two-week iterations, one column is typically one week. I use two rows to show the start and end dates for each week. Under the highlighted cells, I also show the capacity broken down by role, as shown in Figure 2 (below).
There are of course a plethora of parameters and factors to consider while planning a project and the above is just the tip of the iceberg. But then other details are subject matter for other articles.
For more information on using Excel for your project managment needs read:
Creating a Pareto Chart in Microsoft Excel 2007, by Michele McDonough
Using Excel to Track Your Action Items, by Ronda Roberts