How to Calculate the Float by Using a Precedence Diagram: Keep Your Project On Time
Understanding the Float
After determining the critical path, you can calculate the float of an activity to determine the duration of activity delay that the project can tolerate before the project comes in late. Given this definition, what do you think is the float for the activities on the critical path? You got it, the float for any activity on the critical path is zero. This means that if any activity on the critical path is delayed, the project will be delayed.
Let’s now calculate the float for each activity on the other paths.
Knowing How to Calculate It
To calculate the Float of each activity, you need to:
- Create a Precedence Diagram and identify the Critical Path.
- Calculate the Float of Each Activity in the Non-Critical Paths.
Create a Precedence Diagram and Identify the Critical Path
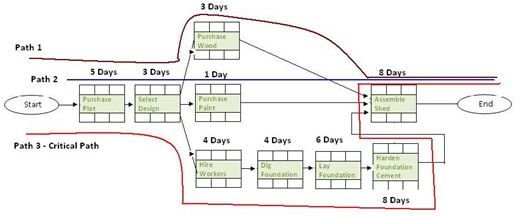
Here is a Precedence Diagram. (Click the image for a larger view.) As you can see from this diagram, there are three paths. By looking at the duration of each path, you can identify the critical path activities, as shown in the image below.
Calculate the Float of Each Activity on the Non-Critical Paths
The critical path activities have a float of zero. To calculate the float of each activity on the non-critical paths, you must identify the next longest path and then subtract its duration from the duration of the critical path. This will give you the float for each activity on the path being examined.
Note: When you calculate the float, it is crucial for you to calculate the float in the order of longest to the shortest.
For example, the float for Path 1 is:
Float for activities on Path 1 = Duration of critical path – Duration of Path 1
= 38 days – 19 days = 19 days
The float for each activity on Path 1 is 19 days. The Purchase Plot, Select Design, and Assemble Shed activities also lie on another path (the critical path), for which we’ve already calculated the float. Therefore, though these activities lie on Path 1, the float you will take will be that of the longer path. In other words, the float for Purchase Plot, Select Design, and Assemble Shed is not 19, but 0. This is the reason why you must calculate float from the longest path to the shortest.
Now, let’s calculate the float for the next longest path – Path 2.
Float for activities on Path 2 = Duration of critical path – Duration of Path 2
= 38 days – 17 days = 21 days
Interpreting the Float Results
The float of an activity informs you the amount of extra time for each activity. The Purchase Wood activity can come in 19 days late, while the Purchase Paint activities can be delayed by 21 days. This gives you time.
Suppose the Purchase Wood activity was scheduled for completion on October 1. But if it is delayed and will only be completed on October 17, your project will still be delivered on time. However, if the Purchase Wood activity is completed on October 22, your project will be delayed. This is because 22 – 1 = 20 days, which is 1 day over the float for that activity. When such a case occurs, the critical path of the project will also change. Path 1 will now be the critical path. Ideally, this should not happen. The risk should have been mitigated.