Choosing Which Root Cause Analysis Technique to Use: Consider the Basic Requirements & Common Uses
The Basics of Root Cause Analysis (RCA)
In determining which RCA technique to use, it should be clear that there are no universal standards on which to base this decision. Performing an analysis of causal factors requires the investigation of available data or resources that only form part of a whole picture. The whole picture refers to an event that brought about undesired results or outcome, which is generally known as “the problem”; hence, the technique to use will depend on the degree of the problem and the quality of data to analyze.
Nevertheless, each RCA method has its own characteristics as far as approach is concerned but all are basically designed to uncover the main source of the causal factors leading to an undesirable event. This therefore, could serve as a guide for determining, which method is most practical to use.
The Cause and Effect (Fishbone Diagram) Method
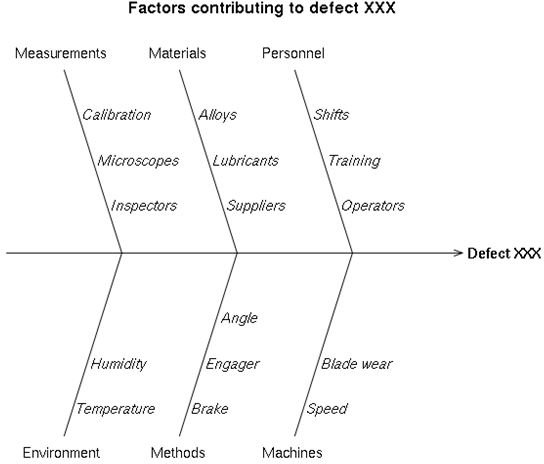
One of the most popular, although not necessarily the most recommended, techniques is “the cause and effect” analysis using the fishbone diagram or Ishikawa method. This can be used at the beginning of the analysis stage where the problem has been well-defined and the circumstances or conditions to explore are not exceedingly broad.
1. A fishbone diagram is commonly used for:
-
Exploring a pre-defined cause without the need to follow specific areas to investigate and make use of suppositions and data that conform to the storyline and timeline of an event.
-
Conducting an analysis that does not require a high degree of training and experience for its practitioner.
-
Pooling of ideas that involves team member participation in order to explore all levels of exposure to a cause being investigated.
-
Organizing information and establishing their links to the causes that led to an undesirable event.
-
Allowing hypothetical ideas to enter the scenario in order to gain as much insights to probable and probable causes..
2. The fishbone diagram has been commonly used by service and manufacturing industries in relation to:
-
The analysis of human responses and behaviors for which the objective is to deal with the recurrence of situational problems. Underlying causes are mostly answers to questions as to “what happened?” and “why it happened?”
-
The review of policy compliance and effectiveness — usually required by regulators or the customers’ demand for certification as a way of ensuring quality based on standards. The aim is to implement real solutions especially if the workplace culture is a large contributing factor. Questions as to why there is lack of compliance, what department is involved, as well as probing when, how and why does it happen? In this aspect however, the answers should not be hypothetical but based on actual events in order to come up with workable solutions that will not hamper the workflow processes.
-
The assessment of procedural efficiency and adherence, as part of day-to-day activities especially if it impacts the business beyond the tolerable level. Workplace accidents and violation of government laws are the events that require preventive solutions against occurrence or recurrence. Another aspect is the desire to continuously improve a product in order to achieve an edge over the competitors’ offers. Both aspects are broad and the usefulness of the fishbone diagram in exploring all possible causes and sub-causes are best served if the data are logically categorized.
-
The management of assets in order to determine adequacy, suitability and relevance of available facilities, tools, equipment and their technologies. Areas for analysis are the assets that destabilize the efficiency of the cash flow due to the occurrence of breakdowns, accidents, major repairs or capital acquisitions. What would be the effect of a major capital investment? Will it increase productivity and in what way? Can the cost be recovered by the increased productivity? If so, by how much? Will it entail removing some of the workforce? In doing so, what would be the potential consequences? Is the company prepared to meet the additional costs?
- The methods and materials used to produce or to render the products or services. In light of the present regulations for environmental compliance, certain green materials and methods can impact the quality of the product, its shelf-life, its marketability and affordability for the customer. Green technologies and materials tend to be capital intensive but are said to be recoverable through their cost-cutting efficiency. However, since the change of methodology and materials could affect the quality and price of the product, the possible effects should be clearly defined by extensively exploring all the risks that have to be addressed.
Keep it in mind that the “cause and effect” method using the fishbone diagram allows hypothetical statements. Thus, the core reason established as root cause may call for further confirmation by conducting supplementary observations or sending out surveys.
However, a reverse method of performing the “cause and analysis” technique, particularly if it involves a large amount of information, is to send-out surveys as the initial step. Analyze the data gathered using the Pareto chart or the 80-20 principle. After which, the resulting 20 percent would be subject to further analysis by determining their causes and related effects.
5-Why Method
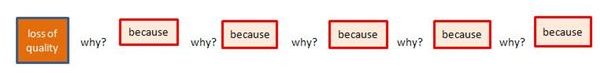
Some are inclined to use this root cause analysis technique because of its simplicity. Be in the know however, that it is also faulted for its limited capability to explore other areas.
Nonetheless, the 5-why method was popularized by the Toyota Company because they have found it effective, largely because of the ease by which it can be adopted.
If by the fifth question or thereabouts, no more why questions are prompted, the last answer is deemed as the root cause. It is appreciated in this aspect, since the root cause could be established without the need for data segregation and statistical analysis.
-
On the other hand, if by the fifth question, the answer derived leads to faulty reasoning or is not as intuitive as expected, it is suggested that another rood cause analysis technique be applied.
-
The 5-why method is supposed to follow a linear-progression of logical reasoning, and the process works by commencing with the outcome and continues by tracing back the sequence of actual events down to its origination. Still, the process can still go into details and proceed using more than five why questions for as long as the sub-causes reveal relevant information.
-
This RCA technique is widely used in the health care industry where patients have concerns or complaints that need to be immediately addressed. The typical frameworks it can effectively broach are the day-to-day service activities related to:
1. Improvements due to loss of quality or regression of production capacity, usually as an approach to lean manufacturing. However, the analysis has to start with the initial phase of data gathering via a Pareto chart. Take note that the data should be based on facts since the aim is to arrive at a quick-solution. Other aspects of lean manufacturing to which this root cause analysis technique applies are: (1) breakdown or inefficiency of equipment, (2) time loss, and (3) waste reduction toward zero-waste attainment.
2. Investigate incidents that led to serious injuries or accidents. The analysis makes use of the known 4-P’s of information, namely people, paper, parts and position as gathered from separate interviews and available resources. Here, questions asked are still open-ended in order to collect the most confirmed version of the accident. “Why” questions are asked last.
3. To assess environmental incidents in order to formulate counter-measures, such as groundwater or soil contamination, indoor or outdoor air emissions and like-incidents that can severely impact the environment.
Once the root cause is established and the solution or counter-measure is put in place, it is always the best practice to test whether the latter’s application reveals positive results.
Fault Tree Analysis
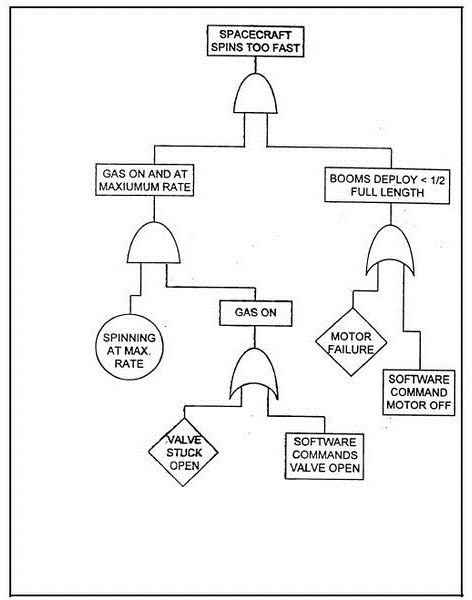
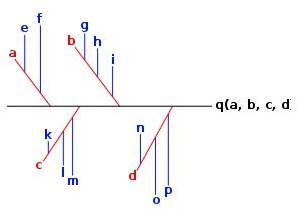
The fault tree analysis was originally conceptualized in the 60s as part of the reliability and safety measures of engineering disciplines. The graphical presentation starts with the known hazards or failures of a system and logic symbols called “gates” connect each segment leading to the incident or to the foreseen events.
In manufacturing industries, it is mostly recommended for large and complex systems of mechanical and structural components—to analyze human failures or to determine redundant arrangements.
Typical hazard or mechanical failure problems investigated using this root cause analysis technique are:
- Major loss of production
- Failure to complete a mission
- Toxic emissions
- Unexplained explosion
- Failure of safety mechanisms
In most cases, human error or oversight in operating, controlling or monitoring is regarded as the cause. This is in view of the safety and reliability features integrated as part of the engineering design, and the existence of automatic warning signals or indicators that a certain component is not functioning properly. However, there are those who contest this theory—particularly in the airline industry,
Thus, the fault tree method was further developed into a root cause analysis technique using sophisticated software programs. There after, other industries like automotive, rail transport and chemical manufacturing companies came to regard this RCA method as essential to their risk management procedures.
At the Root of the Root Cause Analysis
In choosing which root cause analysis technique to use, knowledge of their basic characteristics, capabilities and data requirements serve as a guide for making informed decisions. There are other methods and tools available, and used in analyzing the underlying causes of problems or undesired events. The discussions for the three methods featured above are supplementary to the overviews provided in a separate article entitled Overview of Different Root Cause Analysis Methods.
References:
- HCIPproject.com- USAID Health Care Improvement Project –Cause and Effect Analysis lifted from https://www.hciproject.org/improvement_tools/improvement_methods/analytical_tools/cause_effect_analysis
- ISixSigma.com - Determine the Root Cause: 5 Whys lifted from https://www.isixsigma.com/index.php?option=com_k2&view=item&id=1308:determine-the-root-cause-5-whys&Itemid=200
- FaultTree.org - Fault Tree Analysis lifted from https://www.faulttree.org/
Image Credits: Accidents by Mikael Häggström for Wikimedia Commons; Fishbone by Jake Choules for Wikimedia Commons; Cause and effect diagram for defect by DanielPenfield; Screenshot image of the 5-Why Cause Map Diagram was created by the author; Example of High Level Fault Tree from NASA Software Safety Guidebook