In Focus: Root Cause Analysis Methods
Origins of Analyzing the Root Causes in Risk Management
The development of root cause analysis as part of project management disciplines can be traced back to the 70s when a cognitive psychologist named James Reason expounded on the analysis of human error. His studies led to the conclusion that most errors occur due to lack of clear and definitive specifications about plans of actions. As a result, human errors occur when the doer of the action tends to function automatically and, at times, performs while in a state of absent-mindedness.
Professor Reason’s logic was so widely received that he became one of the leading innovators of tools for improving patient safety in the health care industries.
In 1975, a chemical engineer named Ludwig Benner developed a technique for the U.S. National Transportation Safety Board for investigating hazmat transportation accidents. He developed an analytical tool in which causal factors were charted. It became a part of investigative procedures for analyzing observations or any information related to an accident’s occurrence.
It was in the year 2000 that the Joint Commission on Accreditation of Healthcare Organizations formally submitted to a U.S. Senate subcommittee their recommendations for reducing adverse events arising from medical errors. The solution was to develop mechanisms that would ensure patient safety. The recommendation included root cause analysis (RCA) as an important tool to ensure efficiency of performance and to correct the recurrence of unlikely events.
As the years unfolded, the analysis of causal factors became an important discipline for different types of organizations. Initially, RCA methods delved mostly into human errors and equipment failures, until the advent of computer automation gave rise to systems malfunction. Factors such as demands for quality and environmental stewardship, as well as safety and reliability issues, created conditions that required monitoring of causal factors as part of the procedure. As a note, a causal factor in layman’s terms means a symptom or a warning sign.
Premature conclusions and unfounded conjectures merely impress theories — thereby resulting in half-baked solutions that only make the problems worse. Thus, the matter of identifying the root of a problem has been developed into a form of discipline adopted by various organizations.
The root cause analysis methods being used in today’s more complex systems and procedures go beyond scratching the surface but entail digging deeper into the underlying causes. The purpose of this is to isolate the core reason that gives rise to a causal factor.
In project management, there are several tools and methods used for monitoring negative indicators that could jeopardize the project’s continuity or outcome. Overviews for three of the most popular RCA methods are featured below, to provide readers with more insights on analyzing through charting techniques. They are systematic methods of deliberation and evaluation of negative indicators and their relationships to underlying events.
1. The Cause and Effect Method
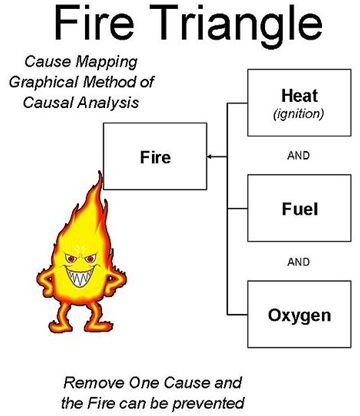
Ancient philosophical views have always regarded the concept that there is a precursory factor to every event or incident that transpires. This became known as the “cause and effect” theory in modern day context and is the main principle recognized in most root cause analysis methods.
The main concept is to list and explore all possible causes, whether perceived or real, as long as they manifest a relationship to the events that would lead to a particular effect or output. Causes are charted in tree diagrams, of which the most popularly used is the fishbone diagram.
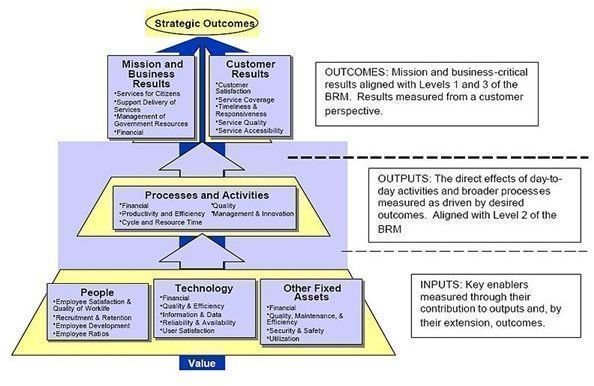
Image Credit: Performance Reference Model - a work of the United States Federal Governmen/Wikimedia Commons
Please proceed to page 2, where this article presents the mechanics of the fishbone diagram as a tool for root cause analysis using the “cause-and-effect method”.
1. The Cause and Effect Method (continued)
The Fishbone Diagram
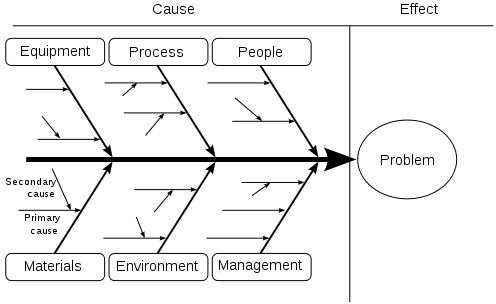
This tool is recommended for group discussion as participants brainstorm on all possible causes and underlying events, conditions or elements that give rise to a causal factor. The basic fishbone structure begins with a single horizontal line as the body or spine with its right end point, usually an arrow head, leading to a specific effect, outcome or event. This is to establish the main agenda or subject of root cause analysis.
The fishbone structure is completed by extending vertical lines on each side, all of which represent the groupings for the major causal factors. The groupings are based on suitability of the categories. Let’s say for a manufacturing industry, the most common groupings used are (1) manpower or human, (2) machinery or equipment, (3) materials and (4) methods or process. The symptoms are then arranged according to their order of hierarchy or degree of significance.
Each group branches out into smaller lines as the discussion progresses by posing the question “why does this particular event, outcome or incident occur?” The answers that crop up are annexed as smaller lines to the causal factor. The brainstorming and branching out processes likewise continue until all possibilities have been exhausted. After this is done, deliberations on the final answers will be made in order to arrive at the likeliest underlying reason or root cause.
The “cause and effect” method is not limited to the use of the fishbone diagram and the latter is not the method itself. It is only one of the tools used as charting techniques for this type of root cause analysis.
The popularity of the fishbone chart is based on its ease of use during group discussions. The tree diagram is a more formal manner of depicting the “cause and effect” method, especially for presentation of solutions or project plans.
Image Credit: Ishikawa Fishbone Diagram by FabianLange/Wikimedia Commons
2. The 5-Whys Method
This type of RCA is often recommended because it does not require the grouping or segmentation of data into logical categories. Instead, information is classified into data sets to represent a certain type of category, like response, trend or behavior.
The process involves asking at least five (5) why questions, although the number of “why” questions to ask is arbitrary. It could actually go on until there is no more logical or useful information that could be derived from the answers. The five why questions are only based on a supposition that by the fifth query, the answer derived is the most logical underlying reason or root cause.
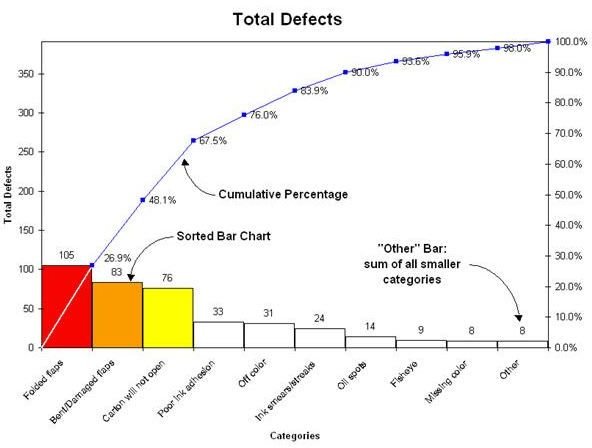
The most recommended tool for analyzing data sets is the Pareto chart, also known as the 80-20 rule. The results are the bases for establishing the drivers or the influencing factors that makes it imperative for management to seek solutions or improvement.
To continue with an example, let’s say one of the factors belonging to the top 20 percent of reasons that are driving down business profits is a non-performing product for which most customers express dissatisfaction. The following five questions would then be asked and investigated for purposes of providing the most accurate answers:
1. Why are customers not satisfied with this product?
- Most customers who purchased the product complained of technical defects.
2. Why are there technical defects in the product?
- The plastic parts of the product are brittle; thus the products tend to break down easily.
3. Why are the plastic parts brittle?
- After conducting a thorough observation of the processes, it has been observed that the products are too tightly packed, in the sense that the temperature inside the package becomes too low. The remaining space is not enough once the chain of polymer reacts to the warm temperature; hence, the plastics turn brittle due to the compressing stress.
4. Why are the products being tightly packed?
- There are no thermal cycling checks being done to test the reactions of the plastic product as it passes from hot to cold and then goes back to warm or hot temperature inside the packaging.
5. Why is there no thermal cycling check being performed?
- The procedure was not included in the checklist for the automated packaging system.
Please continue on page 3 for more about root cause analysis methods
Image Credit: Pareto by Smarthu/Wikimedia Commons
3. Fault Tree Analysis Method
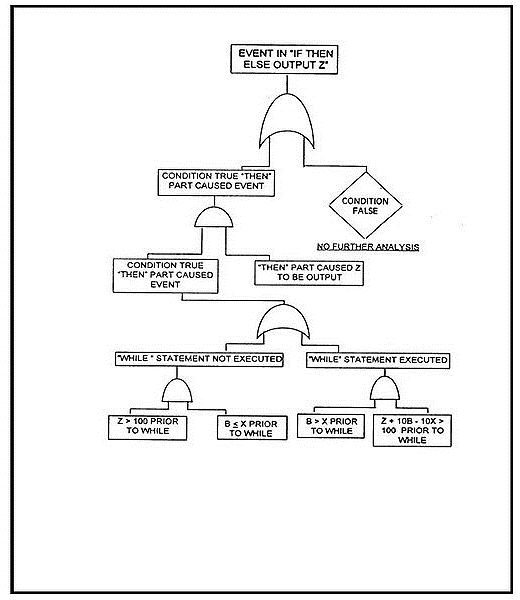
Fault tree analysis (FTA) is the method often used for developing and designing engineering projects — for identifying the possible failures that may arise from causal relationships in a system. Although this method was first conceived during the 60s, it was more a part of the U.S. Air Force’s Minuteman Launch Control System and Minuteman Missile System. The Boeing Company later adopted the FTA as part of their simulation programs for evaluating their commercial aircraft designs.
In later years the fault tree theory became more advanced as new algorithms and software were developed, particularly by the nuclear power industry. The FTA was widely recognized as so effective that other industries followed suit. Examples of such industries include manufacturers for aircrafts, aerospace, power systems, chemicals and their processing, oil platforms, automotives, rail transport vehicles and, lately, the robotics sector.
This root cause analysis method is more of a proactive discipline as it aims to recognize the problem at the point of production to ensure systems safety. This stands opposed to the traditional reactive pose of analyzing the causes only after an accident arising from systems failure has transpired. Hence the fault tree approach for systems improvement and development has become more relevant than ever in modern management.
However, FTA is basically an engineering discipline. The qualitative and quantitative approaches used in evaluating the root cause fault paths make use of Boolean algebra, as well as the reliability and probability theories.
A fault tree analysis to be effective has to make use of accurate computations and multi-phase simulations; fortunately, the advent of sophisticated computer programs have spawned its widespread recognition as an effective tool in various industries.
Image Credit: Example Code Fault Tree: NASA Software Safety Guidebook/Wikimedia
Summary:
The overviews for three of the most popular root cause analysis methods clearly depict the significance of analyzing causal factors as an integral part of risk management. Managing probability issues even if they are at less than 100 percent should remain a vital part of project planning, not just for its negative implications. After all, there is much to be gained if every stage of the project preparation pushes through as originally planned.
References:
Dr. McGreevy, Jeanette, 2008 – Literature Base—Root Cause Analysis lifted from https://docs.google.com/viewer?a=v&q=cache:rlMV6wsAfawJ:www.gpaea.k12.ia.us/media/13320/root%2520cause%2520analysis%2520literature%2520base%2520summary.pdf+origins+of+root+cause+analysis+in+systems+improvement&hl=en&gl=ph&pid=bl&srcid=ADGEEShmtKJxLkTi6CFqYJykxdrWkESRRe6__qNHva4jA7oi5XZX3vsC-vWeDYX0sksVqiI6wYoufDFsZLMwcPTOVbz_8kXmkRF_5Le0uRhC_4W8Tf-oXVcKXE5dKRkb5U23pfGAZbiL&sig=AHIEtbRBL5wS4kpGHjpmok-jjSeO3puVAg