Fault Tree Analysis Template in Excel
Fault tree analysis, a widely adopted and practiced project management technique proposed by H.A.Watson during the early 1960s, tries to identify and assess the probability of faults, failure, and hazards that may be encountered during project execution. To get a better understanding of the concept, a fault tree analysis template in Excel can be downloaded from Bright Hub’s media gallery.
The methodology of a fault tree analysis involves graphically presenting the major faults associated with a project, along with the identified causes for each of the faults and the possible corrective measures. The idea is to identify problems and the corrective measures well in advance of the problems actually surfacing. Here’s the step-by-step procedure to making a fault tree analysis in Excel (using the drawing toolbar).
Preparing a Fault Tree Analysis
Fault tree analysis begins with the identification of the critical fault or failure and further goes on to explore the basic faults and causative factors which are likely to cause the occurrence of the critical fault.
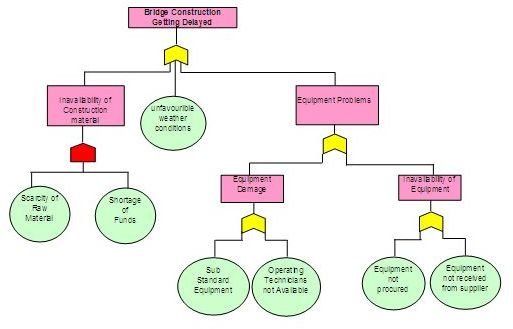
- Critically examining the project process and brainstorming the probable failures at each of the steps will provide you with a comprehensive list of the critical failures that can affect the project. It is always better to prepare a separate fault analysis for each critical fault, focusing first on the more complex and more damaging faults. These critical faults can be anything–a delay in project completion, accidental damages, resource misuse, loss of production or equipment failure, etc. A critical fault is one that has more than one causative factor, is significantly detrimental, and must either be completely eliminated or reduced to prevent it from affecting the progress of a project. The critical fault goes at the top of the fault tree and should be shown in a rectangle, as in the Excel template provided with this article: The ‘bridge construction getting delayed’ is the critical fault.
- The next step of fault analysis involves determining the sub-faults or other independent causative factors which lead to the critical fault. In the provided template the ‘equipment problems’ and ‘unavailability of construction material’ are the sub-events/faults, whereas ‘unfavorable weather conditions’ is an independent causative factor. The sub-faults are again represented in rectangles like the critical fault but the independent causative factors or the basic faults are best displayed in circles. A lot of analytical abilities go into finding these sub-faults and factors, and these are best determined by mid-level staff who are actually involved with the execution of the particular step of the project process.
- With the list of causative factors and the sub-faults in hand, the next step is to apply gates to each of the relational links that exist between the critical fault, the sub-faults, and the independent causative factors. There are two types of gates used in a fault analysis tree –
- AND: where all the sub-faults and the other causative factors must co-exist so as to cause the fault for which they have been identified.
- OR: where the fault will occur even if only one of the sub-faults or the basic factors exists.
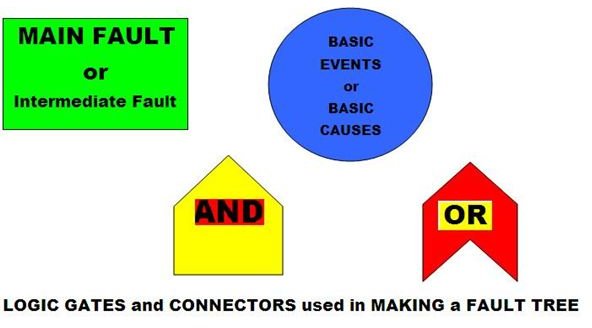
The different shapes that you can use from the drawing menu in Excel at the time of preparing a fault tree analysis template are shown in the image to the right of this text.
Fault tree analysis is an effective way to determine the likely failures and faults associated with a project, but its effectiveness in preventing faults or failures depends immensely on how well a fault tree has been constructed. There is no need for any special software to make a fault tree analysis; it can be easily done within Excel, as is evident from the template provided with this article.
Images Taken By: Sidharth Thakur