Free Example of a Kano Analysis: Uses in the Service Industry
What Is a Kano Analysis?
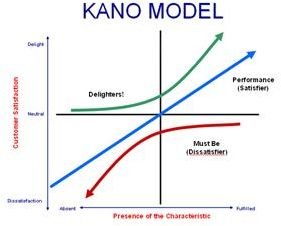
Dr. Noriaki Kano, author of the 2006 book Guide to TQM in Service Industries, developed the Kano Analysis to help those improve, prioritize, and meet customer needs at optimal levels. It also focuses on a way to determine wants and needs based on customer satisfaction tools. The screenshot to the left shows a Kano Model Analysis (click to enlarge).
A Kano Analysis is useful in many service industries to help improve customer satisfaction and analyze established processes.
The Purpose of a Kano Analysis
Six Sigma Master Black Belt E. George Woodley offers up three steps to a Kano Analysis:
- Must Be – Quality is key here or you may lose the customer to a competitor.
- Performance – How well you meet the needs of the customer.
- Delighter – Offering up the unexpected (or bonuses) to the customer.
So, if we utilize these three elements, let’s look first at what the Kano chart reveals.
As you can see from the screenshot above, the Kano Model is essentially an easy-to-visualize x-y chart: The x-axis deals with improving customer satisfaction. The y-axis marks the level of customer satisfaction.
As far as the color lines go on the chart, the red line represents the “must be” level or how well your quality of service is for the customer. The blue line shows how the customer perceives your quality and “performance,” and finally, the green line represents things that come unexpectedly to the customer—or the “delighter.”
Once you implement a Kano Analysis, you can track your data via the chart to see where your weaknesses (or strengths) lie.
An Example of a Kano Analysis
In our Kano Analysis, let’s use an auto repair center to show how this model can help gain top customer satisfaction. Keep in mind a Kano Analysis essentially utilizes Total Quality Management.
Must Be
Think of the must be part of a Kano Model as elements a customer expects. For example, because we have an auto repair center, certainly an absolute “must be” is to have qualified technicians, tools, and parts to service vehicles. If a customer walked in and saw no automotive repair lifts, technicians or tools, he would not use our auto repair center.
Every service industry does indeed offer a service and would require tools or elements to make that service possible. On a funny note, when I moved from one state to another and didn’t want to cook dinner, I drove to the local Arby’s where I was told right off that they were “out of beef.” This essentially led me to another fast food restaurant—meaning their “must be” element was nil.
Because your auto service center does indeed have the qualities a customer expects to see, you would be high on the scale of the must be.
Performance
Beyond how well your service center repairs the vehicle or how fast the customer is attended to upon arrival reflects your performance levels. If you constantly have ill repairs that cause customers to return to the auto repair center, you are missing the mark on quality and lasting repairs.
On the other hand, if you can fix vehicles fast and correctly and receive constant referrals, then you are doing a good job on the Kano performance scale.
Delighters
The delighter scale is perhaps the most essential scale to enhance the must be and the performance in your Kano Analysis.
When a customer returns to pick up the repaired vehicle, do you hand her a bill, collect her money and just let her drive away? Or, do you offer up great smiles and a free lube-oil-filter and thank them for being a valued customer?
The latter is your better option, especially if your goal is to “delight” the customers to guarantee their return. Here, the free lube-oil-filter is unexpected or the delighter.
Using the Kano Analysis
Charting the must bes, performance and delighters is the only way to ensure total quality and success. Further, if your Kano Analysis shows high marks initially, it’s not time to drop the ball and say all is well. The Kano Model should be reviewed constantly because, as we all know, the human element in the service industry is what can make or break customer satisfaction. The goal of Kano chart tracking is to keep customer satisfaction at the highest of levels.
References
Woodley, George E. (2009) The Kano Model: Critical to Quality Characteristics & Kano Model Screenshot - retrieved at: https://www.processexcellencenetwork.com/methodologies-statistical-analysis-and-tools/articles/the-kano-model-critical-to-quality-characteristics/