Six Sigma Project Management: Understanding the Metrics for Hierarchical Business Dashboards
In order to properly assess the success of a business or a specific operational area, business leaders need a set of metrics that can provide a summary of business performance. This summary is often termed a “dashboard” due to its similarity to a vehicle dashboard.
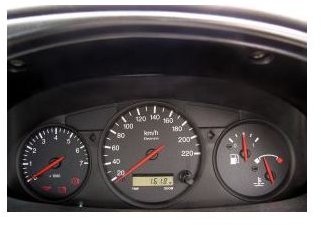
A vehicle’s dashboard provides simultaneous and easy access to information on all the basic performance measures: engine temperature, vehicle speed (speedometer), mileage (odometer), oil pressure, fuel level, and perhaps engine speed (tachometer). With a quick glance a driver can review all the gauges to determine whether anything is cause for concern, or focus on a specific gauge of interest. Some of these measures provide very detailed information, such as the vehicle speed in miles per hour or the engine speed in revolutions per minute. Others are simple indicators of a possible problem, such as the low oil pressure indicator.
Similarly, a business dashboard provides a leader with the ability to quickly review one set of information to see if anything is amiss, or to look at a specific metric of interest. As on the vehicle dashboard, business metrics may be in the form of a specific measurement such as sales rate or defect rate, or may be a signal that is activated when a specific aspect of performance needs attention.
In establishing the dashboard metrics at any level of a business or for any operational area, leaders should consider certain goals. The metrics in combination should provide a balanced view of operational performance, not relying too heavily on only financial measures or only customer satisfaction measures. Metrics should also tie directly to the process steps that comprise the process map already established, ensuring that they can be scaled to apply at different levels of the business.
For instance, our example organization from the first article of this series has these three core processes: Create Product, Sell Product, and Provide Support. The dashboard at Level 1 should provide some visibility to how well the company is performing each of these functions, in terms of satisfying each major stakeholder group. It would include a metric of sales effectiveness, which would be tied to step 2. Level 2 steps include Marketing, Order-taking, and Delivery, so at that level metrics would be established that accurately reflect the effectiveness of those steps and thus directly impact the metric at Level 1.
In the next article we will discuss translating group dashboard metrics into individual performance metrics in the form of a balanced scorecard.
This post is part of the series: Establishing a Business Process Management System for Six Sigma
A business process management system(BPMS) is an effective means of managing and measuring business performance. It involves understanding your processes at different levels, establishing metrics for the business and subgroups, and using metrics to identify when process improvement is necessary.
- Formulating Your Company’s Processes and Values: Getting Started in Business
- BPMS: Core Processes and Hierarchical Process Maps
- BPMS Metrics for Business Dashboards
- Business Process Management System, Part 4: Metrics For Balanced Scorecards
- Business Process Management System, Part 5: Project Selection & Prioritization