Top Ten Critical Success Factors for a Six Sigma Deployment Program: Part 3
According to a research study conducted by SigmaPro, a global provider of six sigma training, and deployment support in conjunction with Aston Business School, a top business teaching & research institutions in the UK, the following tools were identified the tools that work best in a Six Sigma program:
Fishbone Diagram:
Also called a cause and effect diagram, it is used to provide a pictorial display of a list in which you identify and organize possible causes of problems, or factors needed to ensure success of some effort. It is an effective tool that allows people to easily see the relationship between factors to study processes, situations, and for planning. Fishbone diagrams are typically constructed through brainstorming techniques. As a result, they are often drafted by hand on paper. However, two software packages capable of displaying the diagram professionally are AutoCad and CADKEY. Looking for a fishbone diagram template for your project__? Michele McDonough posted a great one in the Project Management Media Gallery.
Pareto Chart:
A representation of the relative importance of process causes or defects, based on the rule of thumb that 80% of all problems result from 20% of the causes. A downloadable Pareto Chart template, posted by Michele McDonough, is available in the Project Management Media Gallery.
Brainstorming:
Brainstorming is a tool used at the initial steps of a project, it consists in encouraging a voluntary generation of a large volume of creative, new and not necessarily traditional ideas by all the participants. It is very beneficial because it helps prevent narrowing the scope of the issue being addressed to the limited vision of a small dominant group of managers .
Since the participants come from different disciplines, the ideas that they bring forth are very unlikely to be uniform in structure and in quintessence so the synergy of gist that they yield needs to be organized for the purpose of the project. If the brainstorming session is unstructured, the participants can give any idea that comes to their minds but this might lead the session to stray away from its objectives.
Key Peformance Indicators (KPIs):
Key Performance Indicators are quantifiable measurements, agreed to beforehand, that reflect the critical success factors of an organization. They will differ depending on the organization. A business may have as one of its Key Performance Indicators the percentage of its income that comes from return customers. Key Performance Indicators are used in performance measurement systems such as the Balanced Scorecard.The ultimate purpose of KPI’s is to drive future performance. The Balanced Scorecard provides the framework for capturing and reporting this performance.
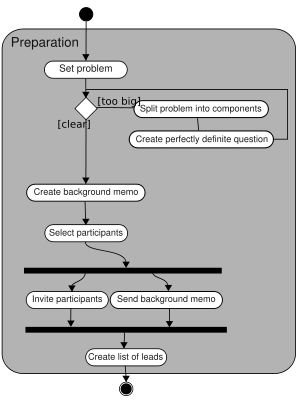
Process Mapping:
It is a hierarchical method for displaying processes that illustrates how a product or transaction is processed. It is a visual representation of the work-flow either within a process - or an image of the whole operation. Process Mapping comprises a stream of activities that transforms a well defined input or set of inputs into a pre-defined set of outputs.
Basic Statistics:
Statistics is a discipline which is concerned with:
- designing experiments and other data collection,
- summarizing information to aid understanding,
- drawing conclusions from data, and
- estimating the present or predicting the future.
Gantt Chart:
Is a bar chart that shows planned work and finished work in relation to time. Each task in a list has a bar corresponding to it. The length of the bar is used to indicate the expected or actual duration of the task. <em>Read the article: The Pro’s and Con’s of Using PERT and GANTT Charts</em> for more indepth information on Gantt charts. Eric Stallworth’s Gantt chart template is an excellent resource for any project manager.
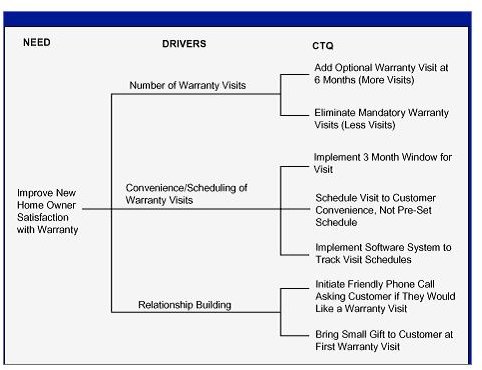
Critical-to-Quality (CTQ) Trees:
CTQs (Critical to Quality) are the key measurable characteristics of a product or process whose performance standards or specification limits must be met in order to satisfy the customer. They align improvement or design efforts with customer requirements.
One important aspect to remember is that it is vital that management have at least basic awareness training of these tools, in them in order to appreciate their impact. Unfortunately, it seems that this rarely happens. “In my experience, they are often reluctant to do this,” states SigmaPro. “And this has a significant negative impact on initiative success.”One worrying result of the research is the apparent fact that more often than not, the urgency of a project determines the selection of tools: the more urgent a project, the more likely a simple tool tends be used, even if it is not the most appropriate or effective.
This post is part of the series: Top Ten Critical Success Factors for Six Sigma
This is the first article in a three-part series that focuses on the the Top Ten Critical Success Factors for Six Sigma.