How Can Pareto Analysis Be Used on Surveys?
About Pareto Analysis
The Pareto Principle, attributed to Vilfredo Pareto, states that in many situations, 80 percent of the effects or outcomes come from only 20 percent of the sources or causes. For example, he originally observed that 20 percent of the population owned 80 percent of the land, and that 80 percent of the peas in his garden came from only 20 percent of the pea pods.
In business settings, you are likely to find that 20 percent of your customers are responsible for 80 percent of the complaints you receive, that 80 percent of income comes from 20 percent of customers or donors, or that 80 percent of problems in a process come from only 20 percent of the types of units processed.
Pareto analysis in Six Sigma involves looking at process data in a way that lets you assess whether the Pareto principle applies. Why is this important? Remember that one aspect of the Six Sigma methodology and mindset requires focusing on the critical few business priorities and chartering projects based on the likelihood of maximum impact.
Thus Pareto analysis can be applied to process defect or customer complaint data to determine whether there are a few sources of problems that should be the focus of new DMAIC projects. And within an existing DMAIC project, often in the Measure phase, project teams can use Pareto analysis to assess data regarding the process defect under investigation. The results of the analysis should help the team to focus in on the specific performance problem and to further narrow the project goal. Check out our article When to Use a Pareto Chart for some examples.
One type of data that lends itself particularly well to Pareto analysis is Voice of the Customer (VOC) data. Collecting this data is a key component of the Define phase of DMAIC, and can incorporate conducting customer surveys, holding focus groups, reviewing complaints and other correspondence, reviewing support call reasons, and conducting individual interviews. Conducting surveys is a commonly used technique because it allows project leaders to reach a large number of customers and to obtain information specifically focused on the problem at hand.
Pareto Analysis for Surveys
So how can Pareto analysis be used on surveys? Any time you collect discrete attribute data (also known as categorical data) you can apply Pareto analysis to your survey data. For instance, if you are gathering information from customers regarding types of problems they’ve had with a product or types of improvements they’d most like to see, you have attribute data that you can subject to Pareto analysis.
You might also be collecting other types of data that are not themselves categorical, such as satisfaction ratings, that can then be broken out in your data set into categories. For instance, if you are gathering data on customer satisfaction with technical support calls, you can break the data out by support representative, by product type, or by customer type.
Regardless of the specific data you gather, the process for conducting Pareto analysis for surveys is the same.
1. Aggregrate your data so that you have a count of the number of occurrences in each category.
For example, tabulate the number of poor satisfaction ratings for each product type or support representative, or tabulate the number of customers who experienced each type of product problem.
2. Create a Pareto chart from the tabulated data.
You can do this using a program like Minitab or with an add-in for Excel like QI Macros. Depending on the program you use you may even be able to skip step 1 and have the software create your Pareto chart from raw data.
3. Examine your chart to determine whether the Pareto principle applies.
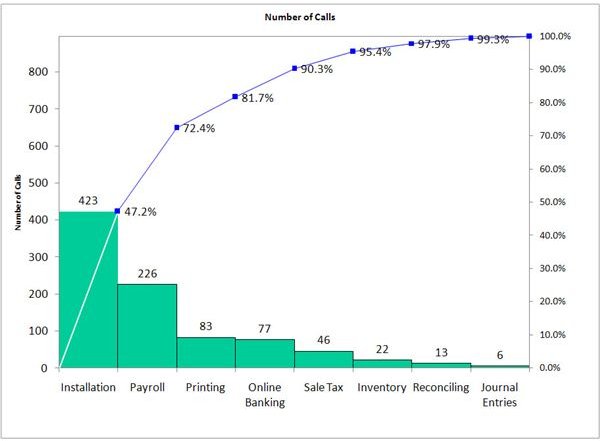
A Pareto chart displays data in order from the most frequent category to the least frequent and includes the cumulative percentage. So, for instance, if the data in the first two of nine categories account for 83% of the total data set, the Pareto principle applies. If it takes more than half the categories to reach about 80% of the data, the principle does not apply.
4. Determine the appropriate next step based on the result of your analysis.
If in fact the Pareto principle applies, you would be wise to focus on those first few categories that make up the majority of the results either in selecting projects to charter or in determining how to focus your existing DMAIC project. If the principle clearly does not apply, consider breaking the data out differently. For instance, instead of looking at product complaints by product type, analyze them by customer type or type of problem.
This image shows an example of a Pareto chart (click on it to view it a larger version):
This post is part of the series: Pareto Charts and Analysis
Looking for tips on how to perform a Pareto analysis or how to create a Pareto chart in Excel? Check out some of the other articles in our Pareto series.