How to Prepare an Event Chain Diagram
An event chain diagram is a visual representation of how different events and functions connect with and affect each other. The basic objective of developing an event chain diagram is to identify events and chains of events that have a direct or indirect bearing on the project schedule, and manage them accordingly. An event chain diagram should be prepared, only after the PERT chart has been put in place and the critical path has been clearly delineated on it.
Components of an Event Chain Diagram
Although an event chain diagram may seem like any other process flowchart, it is a more complex depiction of the work-flow—primarily focused on the identified events and functions. Besides showing the events and functions and the relationships between the two, the EC diagram has a lot of other components. In order to get a better understanding of these, please download a sample event chain diagram from Bright Hub’s media gallery, for referential use. Here’s more on the segments or components of an EC diagram.
The information required before an event chain process diagram can be made:
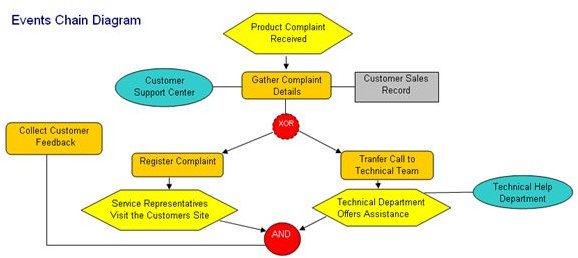
- A list of all the functions that form the basic building blocks of a project. These functions are the basic activities or tasks that need to be executed in order to complete the project. In the sample these functions have been shown in rectangles with rounded corners, like ‘gather complaint details’ and ‘register complaint.’
- A list of events that precede or follow each function. It is these events that link up different functions with each other. Hexagonal boxes are used to show the events.
- Connectors which help in linking up the functions and events also need to be defined for each relationship. Each relationship can be denoted with one of the three types of connectors that are commonly used in event diagrams, which are:
- AND: where all the functions preceding or following an event must be executed
- OR: where the project team can choose and select the activities or functions to be carried out from amongst the options available
- XOR: also referred to as ‘Exclusive OR’ implies where only one of the functions must be executed.
- Organizational Units: The specific teams responsible for each of the functions must also be clearly marked, so that there is no confusion when it comes to responsibility accounting. In the event chain diagram that’s provided with this article the organizational units can be seen in ellipses.
- Information and Resources: Data sources and other material resources that are essential to executing a function can also be presented on the event chain diagram using rectangles connected with the particular function.
- Process Flows: Process flow is shown using directional arrows that connect various events and functions in the chronological order.
Spending some time on making event chain diagrams can be quite rewarding as they provide a clear cut road map to cope with the diverse and complex problems that crop up during project execution. The event process chain diagrams help in presenting the complicated projects in a simplified and more understandable form.
Screenshot by: Sidharth Thakur