Using Network Analysis and Gantt Chart for Project Planning
Project Planning Tools
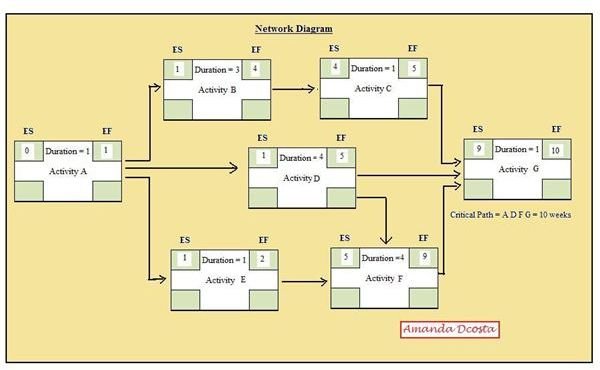
Network Analysis and Gantt Charts are two project management tools that aid in carrying out tasks against a time tangent. In a project, networks form the basis for controlling the project. While the WBS forms the backbone of the project tasks and deliverables, the scheduled time for each task to take place is demonstrated by a network diagram. In a network diagram, each activity has a fixed start time and a fixed finish. Dependencies of tasks are determined by the time allotted for each, where one might start only when a particular task is finished or may start simultaneously alongside another.
Network Diagram Dependencies and Terms
There are four logical dependencies that are followed in a network diagram.
- Finish - Start (One activity has to finish before the next activity starts. Eg. Sit in a car. Drive the car.)
- Start – Start (One activity has to start before the next activity starts. Eg. The guest must begin eating his lunch before the host starts eating his lunch)
- Start – Finish (One activity must start before the next can finish. Eg. Security measures will have to start prior to the President setting out for the function.)
- Finish – Finish (One activity has to complete before the next one finishes. Eg. Security checks will have to be completed before the President’s car arrives.)
Other dependencies worth noting are:
- Mandatory Dependencies: Where it is obvious that activities follow a particular logical pattern irrespective of choice. (Eg. Build the foundation. Erect the walls. )
- Discretionary Dependencies: Dependencies which are not compulsory but are preferred best based on past experiences. (Eg. Painting a wall with vertical strokes as against horizontal strokes.)
- External Dependencies: Dependencies which involve activities that are determined by external agents not directly involved with the project. (Eg. Company XYZ has to write the soft ware before Company ABC can install it.)
Other terms involved with Project Networks are Log (time allowed to speed up an activity) <strong>Lag</strong> (approved time to slow down an activity) <strong>Float</strong> (an approved delay of time which does not affect the overall project duration) and Critical Path (the longest path in a network which has no room for float or delay and is critical to the efficiency of the project’s time schedules.
Gantt Charts
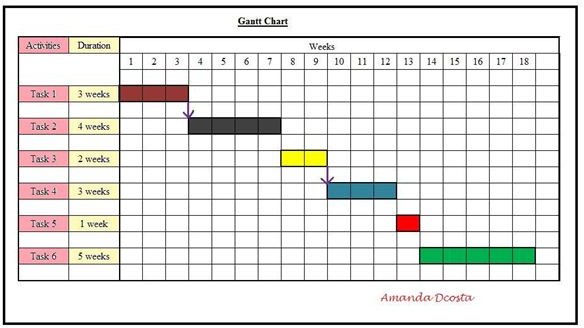
Gantt Charts are charts that were invented by Henry L. Gantt in the early 1900’s. Being an industrialist engineer and looking for ways to simplify control over his projects, he invented the chart which has become popular internationally. Gantt charts are graphical representations of tasks against time. Initially there were no dependencies represented on the chart, but during the more recent decades dependencies too were charted.
In a Gantt Chart, tasks are represented along the vertical axis and have a fixed measure for calculation. Time is represented along the horizontal axis of the graph and may extend as much as the duration allocated for each task. Downward arrows at the beginning or end of the time schedule between tasks indicate dependencies.
Advantages of Network Analysis and Gantt Charts
Network Analysis and Gantt Charts have their advantages.
Network Diagrams:
- Makes maximum use of the four M’s – Man , Machine, Money and Material.
- Optimizes and increases efficiency of stakeholders and tasks designated to each.
- Reduces the overall project duration by managing parallel tasks.
- Since it controls all activities of a project as a whole, the success of a project can be guaranteed.
- Drawing up network diagrams help in identifying all possible tasks that can be undertaken in a project.
Gantt Charts:
- Easy to draw
- Easy to decipher and understand
- Provides clarity of a project’s status
- Easy to use as a briefing tool in a meeting covering a whole set of activities.
- One chart can illustrate many activities.
- One of the easiest ways of reporting and documenting a project’s progress.
- It is a tool that can be used across all streams of work.
Image Credits: Diagrams created by author