Do you find it tough to make a data flow diagram? The detailed article here explains the detailed procedure along with an example of a data flow diagram–which will surely make your life easier.
What Are Data Flow Diagrams?
Data flow diagrams are meant to graphically illustrate the functions and processes of a business. The idea is to present a quick snapshot of how the business works. To help you get a better understanding of how these diagrams are made, take a look at the example below, which illustrates the procedure.
How to Make a Data Flow Diagram
Data flow diagrams can be prepared either for a quick snapshot of the overall business functions or as a detailed diagram for a functional area. We’ll use the example of a customer complaint resolving process for demonstrating how data flow diagrams are made. Here’s the step-by-step procedure.
-
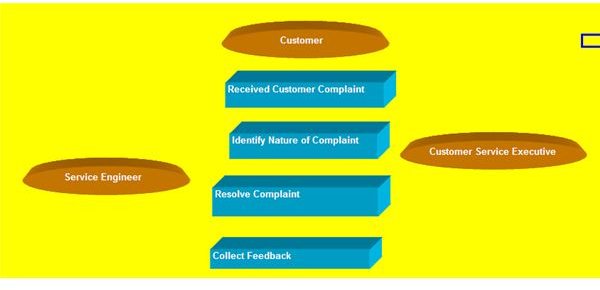
To begin with, the major processes and the entities involved with the data flow are identified. In our example of the data flow diagram these processes are: receiving a customer’s complaint, identifying the nature of the complaint, resolving the issue and getting feedback from the customer. As for the participating entities the list includes: the customer, customer service executive and technical department or engineers. The image below shows all the identified processes in rectangular boxes and entities in ellipses.
-
The next step involves identifying decision points. Decision points are conditional points from where the subsequent process differs depending on the how the condition is satisfied. In our example the decision point is where the Customer Service Representative needs to identify the nature of the complaint. We’re assuming there are three types of complaints: a manufacturing defect, technical failure and service-related problems. The method for resolving each type of complaint will be different, and thus this point is a decision point. Rhombus shapes are used to denote decision points.
Advertisement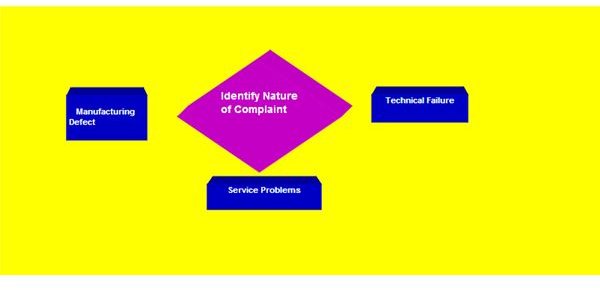
-
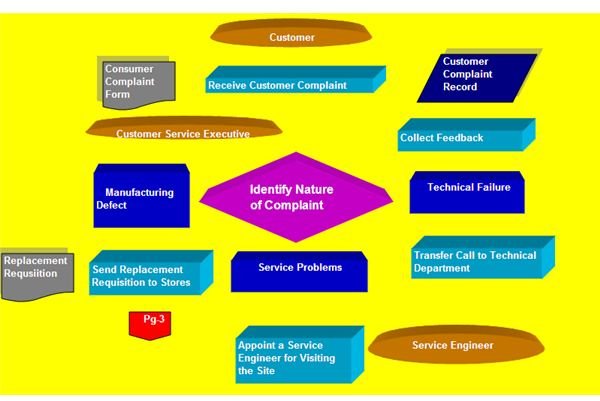
Data sources and documents are important components of a data flow diagram. Every data flow process is likely to refer to some data sources or documents. Also, some documents may be created during some of the sub processes. In our example or a data flow diagram one of the important data sources is the complaint-recording database. Also the feedback obtained after the resolution of the complaint will be recorded in a feedback database, which will be our second data store. Some of the documents that will be required are: the customer complaint form, replacement requisition and product service request.
-
The next task is to put all these things together in a sequential order. It’s quite possible that the initially identified processes may need to be broken down further for a more comprehensive display of the overall process; if so it can be done at this stage. The image below shows how our example of a data flow diagram would look, after everything has been sequentially organized.
-
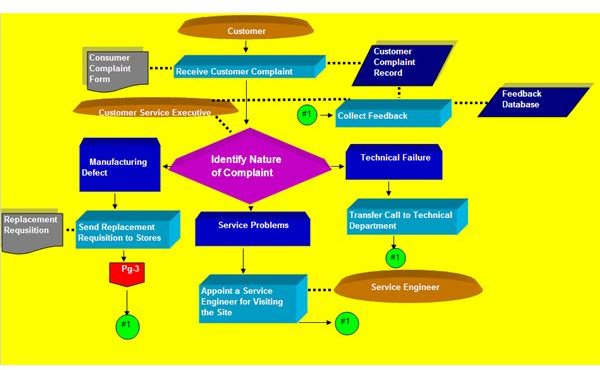
Finally, it’s time to connect the different components of the diagram. Here’s how our finished data flow diagram looks.
 Advertisement
There are some things worth noting in the final diagram:
- The sequence of the processes has been depicted using directional arrows.
- Entities, databases and documents have been attached with different processes using dotted lines.
- There are some processes that need to be detailed separately and thus are shown on a different data flow diagram. There is a detailed procedure for handling replacement of defected products; and since it cannot be covered in this diagram, an off-page connector (that reads Page 3) has been added to guide the user about where he can find more detailed information.
- To avoid confusing crisscrossing lines, process connectors have been used. Each of the complaint resolving measures must follow with feedback collection. And since it would be difficult or rather confusing to add connecting lines from the end of each complaint resolving measure to the feedback process box, process connectors (that read #1) have been used to guide the process flow.
The final data flow diagram gives a clear picture of how information and processes work within a functional area of the business.
References & Credits:
1. GetAhead-Direct.com. Data Flow Diagrams. Retrieved at https://www.getahead-direct.com/gwbadfd.htm
2. Amin Noura (website). What [Are] Data Flow Diagrams? retrieved at https://en.aminnoura.net/the-news/64-how-to-draw-data-flow-diagrams.html
Image Credit:
All Images by: Sidharth Thakur


