How to Create a Time Value Map

A Useful Six Sigma Tool
A time value map can be a very useful tool when utilizing Six Sigma methodology. A time value map tracks a single work item through its process. It accounts for where time is spent on this action item. The time value map begins with the outset of the work item and it tracks it through delivery to the end user. The aim of the time value map is to eliminate waste. As you’ll remember from Six Sigma and Lean Six Sigma, waste is something that should be avoided at all costs. By tracking where time is spent, processes and tasks that do not contribute to the overall quality of the end product can be eliminated, and the process for that product can be streamlined.
A Note About Waste in Project Management
One of the primary goals of the Lean Six Sigma project management methodology is the elimination and reduction of waste. There are different types of waste in the Six Sigma terminology. These seven types of waste are:
- Overproduction - occurs when a product is made without a buyer
- Waiting - occurs when a product sits in waiting for processing
- Transport - occurs when a product is moved to many different places
- Inventory - occurs when a product is stored and it costs money
- Over-processing - occurs when a step in the process is unnecessary or redundant
- Motion - occurs when people move excessively
- Defects - occurs when an error in the process occurs
Companies that wish to save money and resources do well to reduce waste in their processes. The reason a time value map is so crucial to project management is that it allows identification of areas of waste.
Gather Time Value Map Data
The first step in creating a time value map is selecting which work item’s process to track. Perhaps the work item hasn’t been completed quickly enough in the past, or customer complains have led you to determine that it needs tracking. Whatever the reasoning behind selecting a particular work item, make sure that everyone is clear on what is going to be tracked.
Second, you will be tracking the work item in three categories:
- value-added activity
- unavoidable waste
- avoidable waste
A value-added activity is one which adds value to the end product. It is titled value-added because the customer or end-client user is the one that places the value on the product or service you are providing. Unavoidable waste is just like it sounds. It is waste that is an unavoidable part of the business process that the customer is not paying for. Avoidable waste includes things like delayed starts, too many people handling the product, or mistakes that are made.
Draw the Map
Now that you know the three categories, you can track each of the activities involved in the work process. You will need to track each activity involved in the work item’s process and the time it takes to complete the activity.
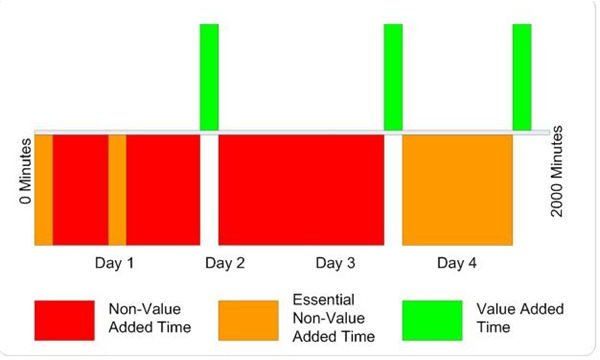
Once you have the data, you can make your time value map. The map will look very much like the one to the left, created by Dylan Jones for the article Lean Techniques to Help Your Data Quality Improvement Initiative.
The center line is the timeline for the entirety of your project’s duration. Above this line, you will chart the activities that are value-added work at the appropriate time on the time line. Below the timeline, you will track the waste. The creator of the chart used two different colors to differentiate between unavoidable and avoidable waste.
Finally, once you have a visualization of the time value in your project, you can begin to eliminate areas of waste and improve the quality and speed of your work item process.