Anything that cannot be measured is difficult to manage. To complete the application of effective 5S in the work place, a system of monitoring and measuring results of its implementation, called 5S Metrics, is important.
What is 5S Metrics?
Keeping track and grading 5S accomplishments is the essence of 5S Metrics. In each of the 5S stages namely: Sort, Systematize, Sweep, Standardize and Self-discipline, activities are checked and results are rated. This method is simply done using a radar chart.
What is a Radar Chart?
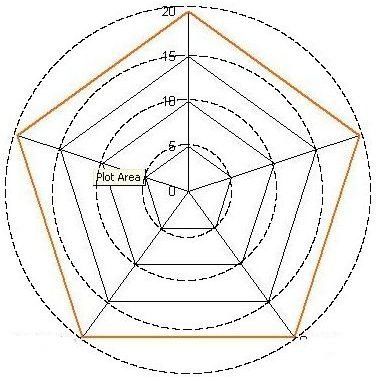
A Radar chart is a graph inside concentric circles with coordinates plotted along the spokes or lines, which represent the radii, drawn from the center to the outermost circumference. The points are connected by straight lines to construct the graph. It is called a “radar” chart because it is similar to the diagram seen on a TV monitor coming from radar equipment.
Likened to giving a small star cut-out as some are in preschool, for a good performance, 5S Metrics awards a pentagon, generated by the radar chart, for a perfect achievement. The figure of the pentagon is not drawn by hand, but is a computer-generated printout created using an electronic spreadsheet such as the Microsoft Office Excel application . If the print out is not a pentagon, it shows that there are some lapses which need to be improved in one or more stages of 5S.
Monitoring Template
To facilitate preparation of the spreadsheet and radar chart, the author developed a 5S metrics application program in Microsoft Excel, which can be downloaded for free. The items in the sheet can be modified to suit the needs of the user. However it is advisable to leave the rows, columns and radar chart intact, otherwise, this may affect the macros or visual basic application program .
Like in all Excel applications with enabled macros, once activated, the template shows a dialogue box asking the user whether to disable or enable macros. In 2003 or higher versions of Microsoft Office, the default security is high, and the macros are disabled by default. There are sites which provide instructions on how to enable the macros in these versions, and the sites can easily be googled.
Matrix
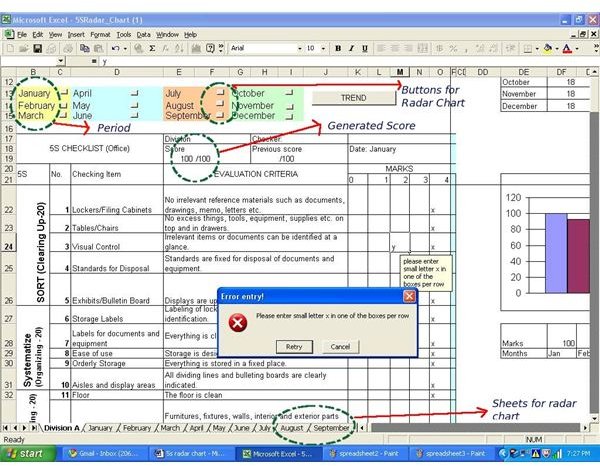
The first sheet of the sample file displays a matrix with headings for 5S checklist, criteria for evaluation, and performance ratings - all arranged in columns. Under 5S checklist headings are the five different stages and the checking items. Usually, the checking items are the areas or methods to observe in a particular stage of 5S. As an example, for the first stage – Sort: things to be looked into are tables, filing cabinets or chairs. The criteria in evaluating them are whether the reference materials such as documents, drawings, memo, and letters are clattered or well arranged for easy access and retrieval.
The criteria are marked numerically. These marks may be ranged from 0 to 4 and interpreted as; 0- very bad, 1-bad, 2-average, 3-good, and 4-very good. Ratings could be done on a periodic basis such as daily, weekly or monthly monitoring.
The first instance of the file will show the matrix for the month of January. To access the matrix for February or other months, left click the name of the month at the upper left above the header. In rating, a letter x is typed under the heading “Mark” for every evaluation criteria. An error message will appear if there is a mistake in placing the marks, like typing more than one x in a row or entering a key other than letter x. After assigning all the marks, the total score ( summed up over the heading of evaluation criteria) and the radar chart are automatically generated for the period of monitoring.
Graph
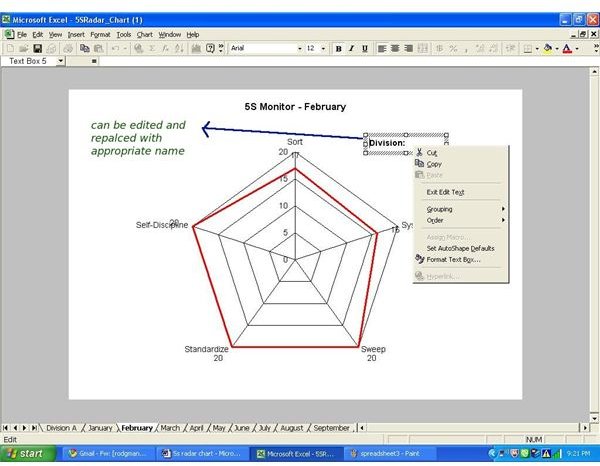
The radar chart can be displayed either by activating the sheet named after the month of monitoring or by hitting the button at the right of the name of the month on the upper left heading of the matrix. The radar chart can be labeled with the unit monitored by right clicking the label “Division” and editing it to place the name of the new unit. To return to the matrix, right click the name of the unit.
Enabling the button “Trend” will show the performance trend of the different 5S stages over the period of monitoring. A return arrow at the bottom of the trend charts facilitates going back to the matrix.
The generated graphs can be printed and posted for everyone to see how the different divisions or units in the company fare in implementing 5S. Saving the file will also create a backup file.
References
Hirano, Hiroyuki. Putting 5S To Work. PHP Institute, Inc., 3-10 Sanbancho, Chiyoda-ku, Tokyo 102 Japan, 1993
Image Credit: raport 2010


