How useful are PERT charts and when do you need them? After a brief look at the history of this project management tool, we’ll give an example and tips for creation.
A Little History
PERT charts first came into existence in 1958 by a company called Booz Allen Hamilton, Inc. They were created for use by the US Navy’s Special Projects unit as part of the Polaris submarine ballistic missile project. The Soviet Union at that time astounded the US with the launch of Sputnik into space, and the US quickly realized they were not the leaders in missile and rocket technology that they thought they were.
So how does this figure into project management? Because of this oversight, the US Navy wanted a simple system to manage and coordinate large and complex projects, so they created the Program Evaluation and Review Technique (PERT). Through its implementation, they found a much easier way to manage the multitude of projects they were dealing with. It became a necessity from that point forward that contractors wishing to do business with the US Navy be familiar with utilizing PERT.
A Detailed Look at PERT
Now that you know where PERT came from, let’s take a look at what is involved in creating a PERT chart. PERT can be described as a network diagram of sorts. The first draft can be as simple as a sketch or can be created in an application such as Microsoft Office Project 2007. Incidentally, in Project 2007 it is called a Network Diagram rather than a PERT chart, but its still the same thing.
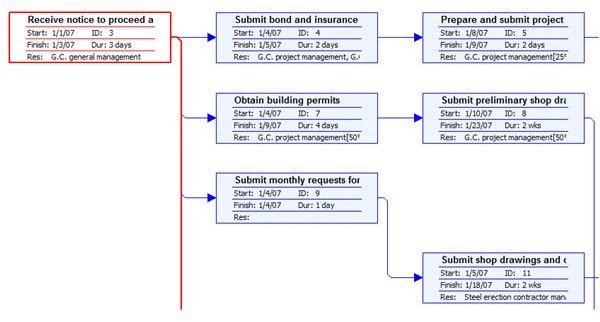
What a PERT chart consists of are milestones or events connected by lines. In the first draft, the events are usually numbered in 10s (i.e. milestone 10, milestone 20, etc). This provides flexibility in case tasks or events need to be added in later. The events are then connected by arrows, and each preceding event must be completed before the next one can begin.
A PERT chart is usually created after most of a project’s tasks have been identified. PERT analysis is best performed near the end of project planning because you need to have at least a basic idea of which tasks are critical and which are less so. Using a software application like Microsoft Project or just a sketchpad, you can sit down and draw out the path of events your project(s) will take.
Since PERT charts are usually for complex projects, there will likely be multiple branches; some of these will be critical paths and some will not. It’s usually customary to include information such as descriptive names and durations of the events, including start and end dates of the various tasks. Color-coding can also be helpful to identify criticality of a given path.
The information in a PERT chart is useful in project management because it presents a graphical view of how the project (or projects) must proceed, what tasks are dependent on previous tasks, and where critical paths (tasks that must succeed in order for the project to succeed) exist. Using Project 2007 , you can create different views by using PERT Analysis .
This involves changing durations of certain events to be pessimistic or optimistic concerning their on-time completion. By analyzing the project using a pessimistic view, you can see just how long it might take if multiple obstacles appear during the project. In contrast, you can also view how the project might progress if the tasks finish earlier than expected.
For example, these various views can help you determine what the effect on the project, as a whole would be if one task were delayed a few days. Or it can be determined what benefits could be reaped by completing a task earlier than expected. If you’d like to see what a PERT chart looks like, an example of one created using Project 2007 is available in the Project Management Media Gallery.
That’s About It
As you can see, a PERT chart can be an effective tool in identifying critical paths and managing tasks. It’s effective for building “what if” scenarios, and it can be useful in planning for possible obstacles along a project’s life cycle . The process has a long history and has been proven useful in just about every complex environment, so it can easily accommodate your project management needs as well.
There are plenty of software applications that can create this type of chart, but, if necessary, it is just as easy to sketch it out on paper. However you create your PERT charts, these useful tools will help you manage your projects all the way to a successful completion.


