In many areas of project management, but most widely used in Six Sigma, project managers seek out the root cause of a problem via the use of a fault tree analysis diagram. What is a fault tree diagram and how is it used? Jean Scheid explains with a template.
The Fault Tree Analysis
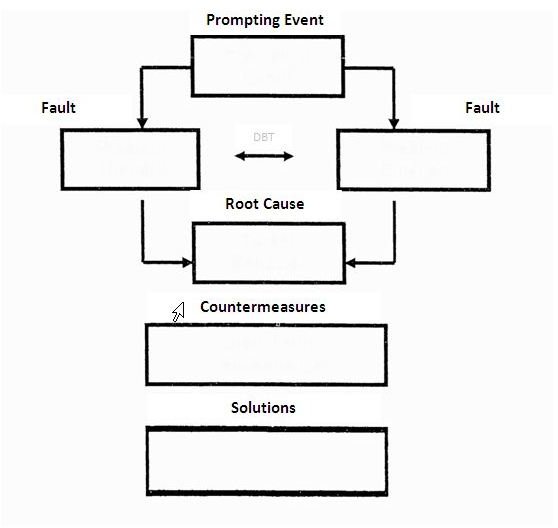
A fault tree analysis (FTA) is used to follow the trail of a problem or risk providing a visual tool that enhances team brainstorming to resolve the problem or risk. First developed by H.A. Watson in 1962 when working at Bell Laboratories, the fault tree diagram has been in use ever since, even more so in Six Sigma projects to prevent and fix defects.
If you are new to Six Sigma and are wondering, what is a fault tree diagram, click on the screenshot to the left to get an idea.
Next, download the free fault tree diagram template from our Media Gallery and let’s get started with our FTA.
As you can see, the diagram is very simple; however, a FTA can be as long, wide, or short as needed to determine the root cause of an unwanted event, issue or problem.
Using the Diagram
Now that you’ve downloaded the fault tree diagram, let’s use an example to see how a project team might use it.
For our purposes, let’s say our project is the development of a new alarm monitoring system; however, time and time again the alarm system turns off without warning.
Prompting Event – The event should be specific and clear. In our example we would simply write “alarm shuts off without warning.”
Faults – Through brainstorming, the Six Sigma team can offer up possible faults such as “power outages” or “wiring problems.” The fault tree diagram can have many faults and should be expanded beyond our two faults where needed and include as many possible faults as possible.
Root Cause – From brainstorming sessions, evaluation, testing and analysis, the project team assigns the root cause . Here, let’s say our root cause is “wiring problems.”
Countermeasures – In a fault tree diagram, a countermeasure is something the team reveals that can be done immediately to alleviate the problem prior to a total fix. Here, the team might come up with using the “alarm override system” as a countermeasure.
Solutions – Once the root cause of the alarm problem has been identified and a quick fix has been implemented as a countermeasure, the project team can then seek out solutions to fix the problem from happening again. The final solution fix may involve stakeholders such as the initial wiring schematics vendor, meaning contact, reevaluating and retesting of the wiring schematics could bring a swift fix. In our example, once the wiring schematics were reanalyzed and changed to work properly, the end of our fault tree diagram would list, “wiring schematics re-worked with vendor.”
More FTA Tips from Bright Hub
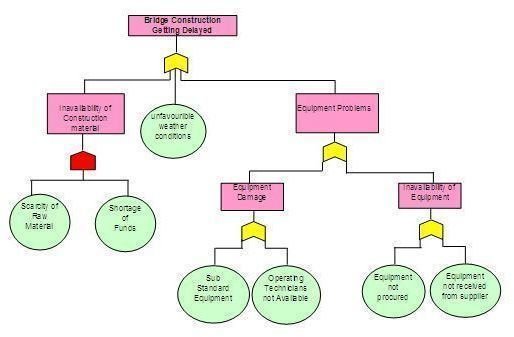
Here, at Bright Hub, you can learn how to create a fault tree diagram in Microsoft Excel as well gain knowledge on using a fault tree analysis as a risk management tool. Bright Hub writer, Sidharth Thakur even offers up a free template of a more in depth diagram .
For project managers that ask, what is a fault tree diagram, many software companies offer programs that are dedicated to creating diagrams; however, Microsoft Visio offers up tools to create diagrams with ease to use in your next project immediately at no cost.
References
Ericson, Cliff “Fault Tree Analysis: A History (1999) retrieved at https://www.fault-tree.net/papers/ericson-fta-history.pdf
Marquis, Hank, itSM Solutions, “Fault Tree Analysis Made Easy” retrieved at https://www.itsmsolutions.com/newsletters/DITYvol4iss47.htm
Image Credits:
Screenshot FTA Diagram by Jean Scheid
Fault Tree Diagram by Sidharth Thakur


