One of the most useful features of the Microsoft Office Project application is the ability to easily and quickly create a PERT chart. Have a project you want to estimate the duration for? Perhaps put together a visual representation of your implementation plan? Follow the simple steps below to create a crisp chart that displays the three potential project completion dates weighted to your specifications.
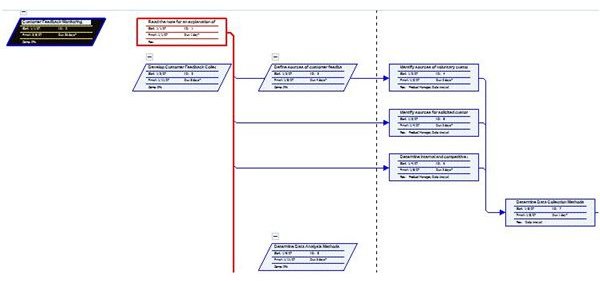
A PERT chart is best utilized as a method to break-down and chart the various steps needed to complete a project and predict the earliest possible completion date. Microsoft Project also has a tool that allows users to display the project as a Network Diagram view, a project perspective that closely resembles the flow-chart view of a PERT Analysis chart. However, unlike the PERT chart, a Network Diagram will outline both the tasks that make up a project and the dependent resources needed to complete the project.
PERT Analysis Charts and Network Diagrams work well when used together as they complement each other and also overlap. Let’s start by creating and printing a PERT Analysis of your project, and follow up by also creating and printing a Network Analysis to best outline and visualize the path your project will need to take to reach completion.
Using the PERT Analysis Toolbar
PERT is short for Program Evaluation and Review Technique. PERT charts display information about project completion time based on the following set formula :
(Optimistic duration + 4 (Expected duration) +Pessimistic duration)/6.
The PERT chart formula was first used by the United States government in the 1950s and has since continued to be used as a reliable method to create timelines for completing projects.
Follow these steps to create and print a PERT chart in Microsoft Office Project.
-
To begin, open the project you would like to make the chart for in Microsoft Office Project.
-
To display the

, go to View menu and place your cursor over the Toolbar menu. Select the PERT Analysis option that is located near the bottom of the menu.
Advertisement -
On the PERT Toolbar, select the PERT Entry Sheet button, the button located at the far right side of the PERT Toolbar
-
Enter in your determined time values into the Optimistic, Expected, and Pessimistic Duration columns for each of the tasks listed in your project.
-
When the numbers have been entered the way you want them, click Calculate PERT on the PERT Analysis Toolbar. This is the middle button on the toolbar.
-
A pop-up message will appear after you hit the button, but don’t be concerned – this is just a confirmation that you want to update the data in you project. Click “Yes” on the pop-up message. The analysis will run.
-
After the process has completed, you will notice the Duration column in the project view will be altered to show the newly calculated length for each task.
-
If you want to alter the weighting of your schedule, you may do so easily by clicking the Set PERT Weights button located on the PERT Analysis toolbar. A small function screen will appear and allow you to redistribute the weighting for the Optimistic, Expected, and Pessimistic columns. Between the three fields, the total number assigned to the weight needs to add up to 6.
-
Re-click Calculate PERT to display any alterations
-
When you are happy with the way your chart looks, click on the Microsoft Office button at the top left of the screen and select Print from the Office menu.
Using the Network Diagram
Network Diagrams are best referenced when you want to look at a visual representation of the project’s scope and the relationship between the tasks and dependent resources. They are visually similar to flow-charts and complement project timeline data that is calculated from PERT charts.
Since no calculations are required in Network Diagrams, they can be created instantaneously by Microsoft Project by simply clicking a button. Follow these steps to create and print your Network Diagram in Microsoft Office Project:
- In Microsoft Project, open the project you would like to display.
For More Help
For more help creating, modifying, and printing PERT Analysis Charts and Network Diagrams, visit Microsoft Office Online. Or, to decide if Microsoft Office Project is right for your business, check out A Review of Microsoft Project 2007: A Good Project Management Resource by Eric Stallsworth, here on Bright Hub.


