Learn how to use Microsoft Visio to create basic process maps (activity flowcharts) and deployment process maps (cross-functional flowcharts).
About Process Maps
Process maps, also known as flowcharts, are a frequently used tool for Six Sigma projects, particularly DMAIC projects. They are used in the Measure phase to illustrate the existing process and during the Improve phase to illustrate the improved process as it is tested and rolled out. They are often included in the training materials created during the Control phase.
While many software programs can be used for creating process maps, Visio is designed specifically for such tasks.
Creating Basic Process Maps
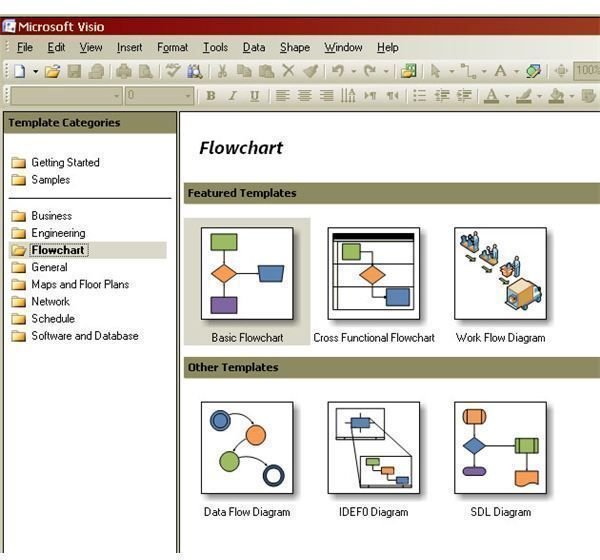
On the starter screen of Visio you can choose a style of process map to create and the appropriate units to display (US or metric). Alternatively, you can select a style by using the New option under the File menu.
On the left side of the new blank page you will see areas where you can select arrows and backgrounds. Another area provides access to a variety of basic flowchart shapes such as process steps, decision points, documents, data and storage, terminators and on- and off-page references.
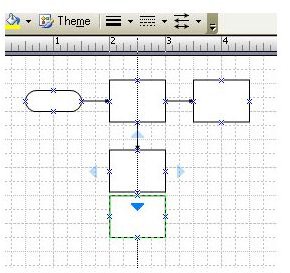
Simply click on the symbol you want to add and drag it to the page where you want to place it. To have a new shape auto-connect to an existing shape, drag a new shape adjacent to the existing shape on the side you want to connect it to. You will see that the arrow on that side becomes highlighted. Let go and it will be connected with a standard connector.
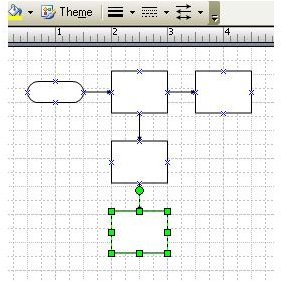
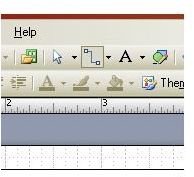
Label each step simply by clicking on the shape you’ve added and typing the text you want to use as the label. Note that if the font size is quite small as you view it, the program will automatically zoom as you type. You can adjust this setting in the Options area of the Tools menu or increase the size of the page on your screen using the percentage control in the toolbar.
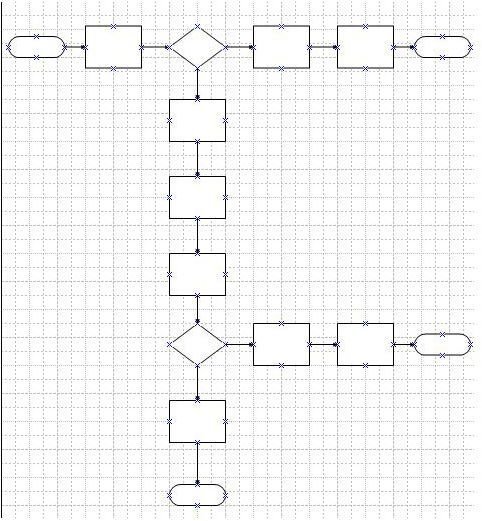
Continue adding process steps, decision points and terminators until your process map is complete.
Creating Deployment Flowcharts
A deployment flowchart or cross-functional flowchart is used to depict the different individuals or groups that perform each step in a process.
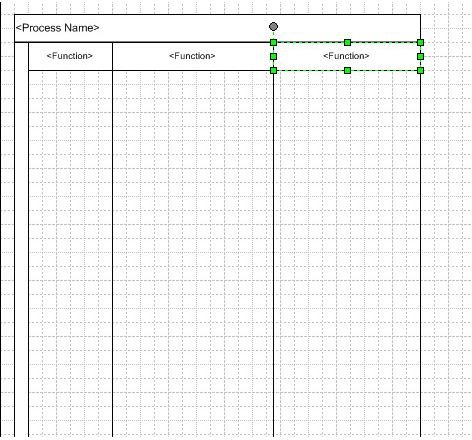
Select the Cross Functional Flowchart when you create a new document from the File menu or start screen. You will be able to choose either a horizontal or a vertical layout, with examples shown of each. The initial chart may not fill the whole page. To expand any functional band, select its label and use the handle to make it larger. The whole band will increase to match the size.
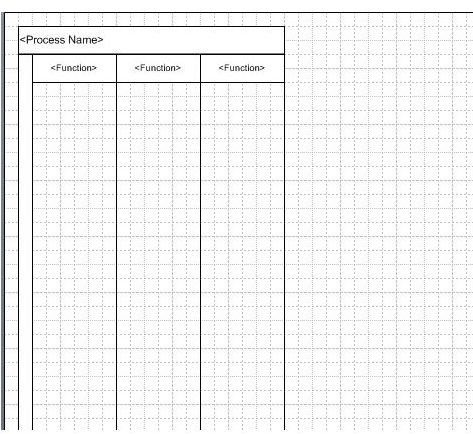
On the left of the new page you will have a new option to add shapes specific to this type of chart, specifically the functional band or the separator.
Adding shapes to the process map is done the same way as for a basic flowchart. However the auto connect may not work effectively, requiring the use of manual connections. Click on the Connector Tool on the main toolbar.
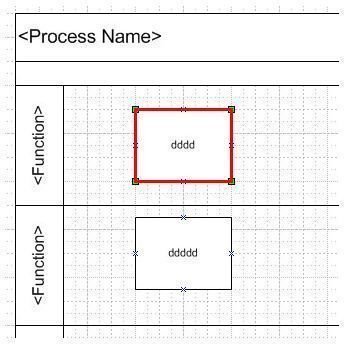
Hold your cursor over the first shape you want to connect until it is highlighted in red. Then drag to the other shape until that shape is highlighted in red. The two shapes will be connected, as in the example below for a horizontal deployment chart.
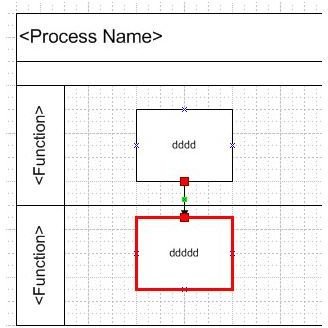
Continue adding shapes, labels and connectors until your flowchart is complete. An example of a vertical deployment chart is below.


