This article discusses S-Curve theory and how it is used in project management as a tool for monitoring the growth, progress and performance of ongoing projects. Understand the S-Curve model, its analysis, data and schedules needed to create the graph that reveals deviations from baseline metrics.
Introduction to the S-Curve Concept
An understanding of S-Curve theory and its analyses will help learners and team members grasp the importance of monitoring the progress and growth of an ongoing project—at a specific stage or percentage of completion. Outside of the technical jargon, the S-Curve model simply makes use of the projected number of man-hours and costs to complete the project vs. the actual number of hours and costs incurred within the same time frame. The proposed time, man-hour and cost data are referred to as the “baseline” data.
Understanding the S-Curve Model
[caption id="" align=“aligncenter” width=“600”]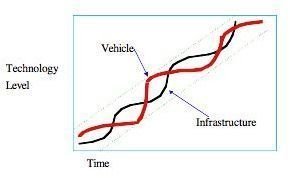 Parallel s-curves[/caption]
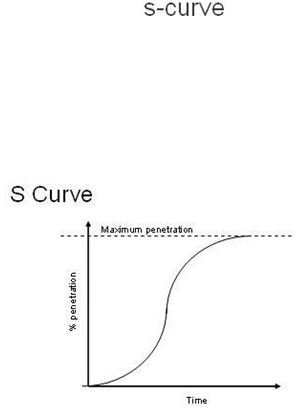
The S-Curve is a form of mathematical theory, which aims to represent the utilization of resources over the proposed time of the project. Simply stated, the curvature illustrates the side by side comparisons of the actual time and expenditure components vs. the proposed time and cost allocations of specific resources. As a tracking tool, comparisons of different S- Curves against the standard S-Curve help in monitoring the growth or progress of the project. Data that is simultaneously plotted in graph form will clearly present how efficiently the team has performed so far, in accordance with the time or budget limitations. Two or more curved lines running symmetrically should both be flat at the beginning and become steep in the center and become flat again towards a convergence at the project’s completion date. This is how most project timelines would be depicted. In today’s highly technological work environment, there are various software-scheduling packages that can automatically generate these S-Curves. However, the matter of understanding the significance of its theory and its analyses is of utmost importance. Image Credit: Coupled S-Curves courtesy of Wikimedia Commons
Plotting and Analyzing the S Curves
If done accurately, the S-Curve analysis of the “actual progress to-date curve” against the “baseline curve” facilitates the achievement of project goals by providing a warning of any project deviations from the baseline standards. The S-Curve is constructed using the dates on the X-Axis and the calculated values on the Y-Axis and by plotting data extracted from baseline or production schedules for each task. The Necessary Tools The Baseline Schedule: It contains information about the actual start date and finish date as well as the information on proposed man-hours and expenditure allocations. Use the data contained in this schedule to create the Baseline S Curve. The Production Schedule: It contains information of the actual man-hours and expenditures incurred for a particular stage of the project.
The Different S-Curve Models and Analysis
The Standard S-Curve Metrics: Baseline S-Curve: This is the S-Curve against which all other S-Curves will be compared as it comprises the proposed allocation of expenditures and man hours to be used for the project’s completion within a proposed duration. The Growth Metrics – this makes use of the Target S-Curve: The Target S-Curve represents the modified Baseline S-Curve figure, inasmuch as the constant monitoring of project performance could result to certain adjustments of the baseline elements. A new standard will then be calculated and becomes the representative of a new set of metrics. They are, however, called target values, to distinguish them from the originally proposed time and costs. As such, these values now represent the new set of metrics after the original baseline was modified. They are applicable as bases for analyses of succeeding work performances after the adjustment cut-off date. Comparisons between the Baseline and the Target curvatures denote growth of the project as far as scope is concerned. Plotting of the Target S-Curve may finish above or below the Baseline S-Curve, in which case:
-
If the scope increases and the baseline duration or time allotment is fixed, then it is likely that the project will be completed beyond the targeted date . This results to what is called the Project Slippage, or the difference between the targeted finish dates vs. the baseline finish date.
-
If the scope increases and the baseline costs or proposed costs are fixed, then it is likely that the project will be completed beyond the budgeted costs, which could result to fewer profits or even potential losses.
-
If the scope decreases and the baseline duration or time allotment is fixed, then it is likely that the project will be completed ahead of the targeted date.
-
If the scope decreases and the baseline costs or proposed costs are fixed, then it is likely that the project will be completed at less than the budgeted costs, which spells greater profits.
[caption id="" align=“aligncenter” width=“600”]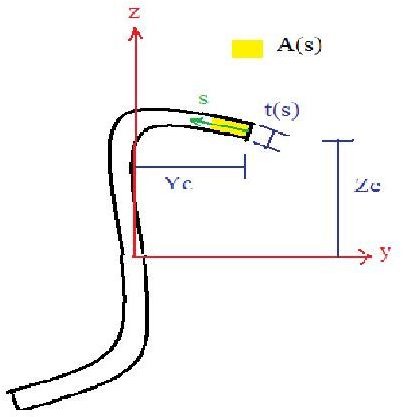 S-curve asymmetric[/caption]
The Progress Metrics – This is a comparison between the Target S-Curve and the Actual S-Curve, in which the latter is a measure of the actual man-hours and expenditures of a project on a specific completion stage date. Ordinarily, the Actual S-Curve is expected to run below the lines of the Target S-Curve, since the results of constant monitoring entails compliance and observance of the targeted time and costs. Hence, the two curved lines are expected to meet or converge towards the end of the project completion. If the curvatures present a graph where the Actual S-Curve runs open-ended above the Target S Curve as of cut-off monitoring date, consider the possibility of errors in the data contained in the production schedules. A careful review should be made to pinpoint unrealistic values of man-hours and costs incurred for the already completed stage. Image Credit S-curve(Asymmetric).jpg courtesy of Wikimedia Commons
Value and Percentage Metrics:
- Cost vs. Time S-Curve: This type of analysis is suitable for projects that require both labor and non-labor intensive elements. The main concern here is the cumulative costs at a specific stage of the project and its effect on the cash flow as well as the potential risks of exceeding the allotted costs.
Creating the Cost vs. Time S-Curve Use the actual cumulative amount of expenditures incurred from baseline start date to cut-off date of progress stage and compare the S curve created against the Baseline S curve for total cost allotment for the same cut-off date.
- Man Hours vs. Time S-Curve: This type of analysis is suitable for projects that are estimated as labor intensive, in which the project manager has to know the cumulative amount of man hours worked at a specific stage of the project. Results of the graph will provide the basis for adjustment, whether there is under-performance that warrants additional labor force or the implementation of closer supervision.
Creating the Man Hours vs. Time S-Curve: Use the actual cumulative amount of man-hours worked from baseline start date to cut-off date of progress stage and compare the S curve created against the Baseline S curve for man-hour allotment for the same cut-off date. As a note, the models and analyses can be used to monitor the different phases or tasks of a project. Since time is of the essence, the convenience of using the most appropriate and multi-faceted project management software allows the application of this theory for different project management scenarios.


