Lost on supply change management and inventory control? I’ve always warned bad inventory management can make or break a business, so here, I’ll teach you an analysis tool guaranteed to help you stay on top of every item in stock.
Alphabet Soup
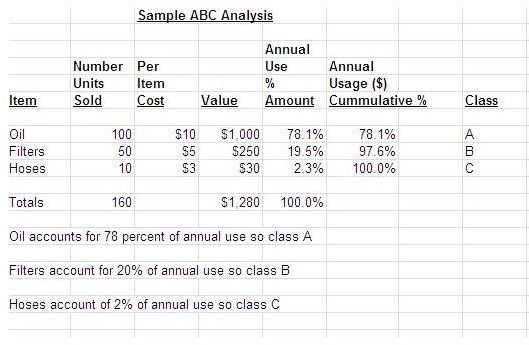
An ABC analysis, or the A, the B and the C don’t represent words, but a certain class of inventory items. When looking at inventory and using this analysis, let’s look at a simple example of an auto repair shop inventory of oil, filters and hoses in the screenshot to the right (click to enlarge).
Oil sales make up 78 percent of annual sales, so this inventory item is classified as “A”
Filter sales make up 20 percent of annual sales, so class this item as “B”
Hose sales make up 2 percent of annual sales, so class this item as “C”
Item Classifications
From the above example, we know our auto repair shop must keep plenty of oil on hand at all times because of its top seller demand status. Because filters do offer 20 percent of annual dollar revenue, they should be looked at as a re-order item based on inventory levels. Hoses only make up 2 percent of repair shop sales so these items should be ordered as needed or a very low level of inventory kept on hand.
Before we learn how to complete the analysis, you can download a free Excel template from our Media Gallery.
Completing the Analysis

To complete your inventory classification analysis, use the following steps:
Complete an Inventory Audit – This is essential because not only will you discover any obsolescent parts but also you will be able to have an accurate count of items on hand along with part numbers.
Calculate Quantity Used – Use your sales general ledger to reveal revenues for the prior year. For example, your sales ledger should show how many of each part you sold in the past year; in our example, the auto repair shop sold 100 units of oil.
Calculate Revenue Dollars – Again, your sales journal should be able to tell you the cost of each oil item and annual sales. In our example, 100 units of oil were sold at $10 per cost, so that’s $1,000 in revenue for the year.
Annual Percentage Amount – Here, calculate each item on the list based on dollar value divided by total revenue sales for all items, or $1,000 of oil divided by $1,280 in total sales = 78%.
Sort the List – Here, based on dollar value volume, sort the list with the top seller at the top and the lowest seller at the bottom.
Cumulative Usage Percent – Once your list is sorted, the item cumulative percentages are calculated based on a running total of the addition of percentages (the spreadsheet download example does this automatically).
Class Your Inventory – When researching an example, I found some experts say classifications should be the largest selling inventory (or inventory that makes up 80 percent of your total sales) should be classified at A. Inventory that makes up 15 percent of your total sales should be classified as B and remaining inventory of 5 percent, classified as C. In the screenshot above, you can see we have:
Oil – Class A
Filters - Class B
Hoses – Class C
Using the Classifications
Most companies who rely heavily on inventory levels can use this system to determine how much inventory should be on hand and when to stock certain inventory items. However, this type of control system is not right for every company.
It’s best used for those who use the Just-In-Time (JIT) or 5S Methodology or for those whose rely on total quality process management to get the product to the end user or vendor as promised and on time.
Auto repair centers, especially larger ones, are a perfect example of ways to use this type of analysis. Because auto repair centers can’t determine what will need to be repaired on every vehicle that arrives, they must base inventory controls on historical data—hence the ABC analysis works well here.
The auto repair center would want to keep on hand, or order on cheaper stock days, oil amounts to cover their need—or keep A inventory items on hand at all times. B Inventory items may be looked at quarterly, where C items can be stocked annually if the ABC tools are used and analyzed correctly.
Finally, the areas where popular inventory items (such as A items) are kept can make a difference. If the auto repair shop knows oil must be close at hand for the repair technicians, it shouldn’t be a long walk away for the technicians to obtain the oil. However, if hoses are used occasionally, they could be placed in a more convenient space based on the needs of the parts inventory manager.
To fully gain control of your inventory, learn more about inventory controls . If any analysis reveals obsolescent inventory you will never sell, either sell it for what you can, even if it’s cents on the dollar, or remove it from your inventory total count and value.
References
Read More About It - Right Here on Bright Hub:
LIFO vs. FIFO: Understanding the Difference
Additional Resources:
Resources Systems Consulting – ABC Analysis
Kaplan and Cooper (1998) Management and Accounting Web
Image Credits:
Analysis screenshot courtesy of author.


