Before creating a project schedule, you need to identify and understand the dependencies between project activities. Incorrectly identifying these dependencies typically causes projects to come in late. One of the benefits of PDM is that it helps in understanding project dependencies visually.
PDM Basics
PDM is a visual representation technique that depicts the activities involved in a project. Precedence Diagrams are also known as Project Network Diagrams. In this article, both terms are used interchangeably. PDM helps you to:
- Communicate: The visual representation makes it easier for you to communicate the flow of project execution or the project activity flow.
- Identify missing activities: When an activity is not identified, it’ll never be done. By visually representing the activities, there is a greater chance for your team to identify missing activities.
- Identify dependencies: Each activity is dependent on some other activity. When a dependency is not identified, the project will be delayed until such a time that identification occurs. For example, if there is a critical component that is being produced by a third-party vendor, the final product is dependent on the vendor. So, even if you complete all other activities, the project will not be complete until the vendor supplies the critical component.
- Identify critical activities: Certain activities have a greater impact on project schedule than others. By using PDMs, you can determine the activities critical to the project schedule. This is known as the Critical Path Method (CPM) .
- Create a project schedule: The final goal of PDM is to create a practical and robust project schedule.
PMP Exam Tip: There are two visualization techniques, PDM and Arrow Diagramming Method (ADM). Of the two, PDM is used most often.
Now, let’s give dependencies a more in-depth look.
Types of Dependencies
There are four types of dependencies that you need to be aware of before creating a Precedence Diagram.
- Finish-Start: In this dependency, an activity cannot start before a previous activity has ended. For example, you cannot cook a stew before gathering all the ingredients. Therefore, the activity “Gather Ingredients” needs to finish, before the activity “Cook Stew” can begin. This is the most commonly used dependency.
- Start-Start: In this dependency, there is a defined relationship between the start of activities.
- Finish-Finish: In this dependency, there is a defined relationship between the end dates of activities.
- Start-Finish: In this dependency, there is a defined relationship between the start of one activity and the end date of a successor activity. This dependency is rarely used.
Precedence Diagram Notation
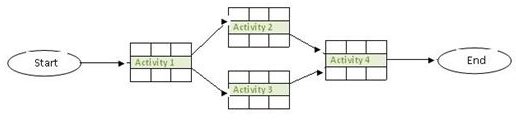
The image displays a simple Precedence Diagram. (Click the image for a larger view.)
You’ll notice that the Precedence Diagram has the following features:
- Events: The Start and End oval shapes signify events. An event is a point in time having no duration, which is also known as a milestone. A Precedence Diagram will always have a Start and an End event.
- Activity: There are four activities (Activity 1, 2, 3, and 4), each activity is represented by a node.
- Dependencies: Each node (Activities and Events) is connected by using uni-directional arrows. This signifies the relationship between activities. The relationship between activities can either be predecessor or successor. For example in the image, Activity 1 has no dependency, Activities 2 and 3 are dependent on Activity 1, while Activity 4 is dependent on Activities 2 and 3.
Note: Since the activities are represented by the node, Precedence Diagrams are also called “activity-on-the-node” diagrams.
A Network Diagram will always have the Start and End events. They may also have other events called milestones. For example, kill-points are milestones. In a Network Diagram, the start of an activity must be linked to the end of another activity.
Next, read how to construct a Precedence Diagram given a list of activities .


