So, you’ve got the project activities list ready. In what sequence, will you implement the project? Construct a Precedence Diagram, a.k.a Project Network Diagram, and you’ll have a visual representation of the project activity flow. You can then also identify the critical path diagram.
Introduction to a Precedence Diagram or a Project Network Diagram
In this article, we’ll illustrate how to construct a Precedence Diagram (Project Network Diagram). The steps are:
- Specify predecessors and successors, given a list of project activities.
- Arrange the project activities in order of execution.
Specify Predecessors and Successors Given a List of Project Activities
This is the first step to creating a Precedence Diagram (Project Network Diagram). In this step, the project activity dependencies are identified. The Precedence Diagram (Project Network Diagram) needs to clearly illustrate these dependencies.
While creating a list of project activities, you need to ask yourself the following questions:
- What project activities happen before the activity being examined?
- What project activities can happen at the same time with this activity?
- What project activities happen after this activity?
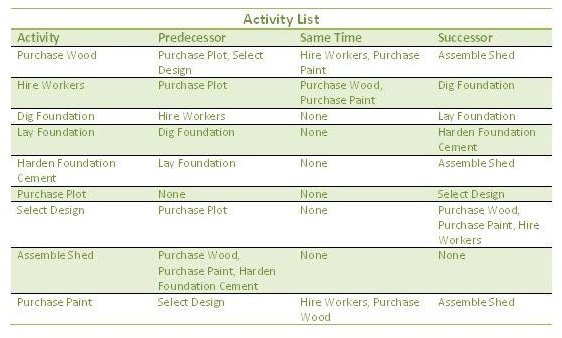
For example, suppose you are constructing a shed and the following activity list has been defined:
Purchase Wood; Hire Workers; Dig Foundation; Lay Foundation; Harden Foundation Cement; Purchase Plot; Select Design; Assemble Shed; Purchase Paint
Suppose, you are examining the Purchase Wood activity. Ask yourself the three questions list above.
- What project activities happen before the activities being examined? Some activities that may occur before the “Purchase Wood” activity include: Purchase Plot and Select Design
- What project activities can happen at the same time with this activity? Some activities that may occur at the same time as “Purchase Wood” activity include: Hire Workers and Purchase Paint
- What project activities happen after this activity? Some activities that may occur after the “Purchase Wood” activity include: Assemble Shed.
From the answers, we have determined the predecessors and successors of the Purchase Wood activity. Similarly, you can examine each project activity and develop relationships between each one (see the image below - click for a larger view). You will then have table of project activities, which also contain information about predecessors and successors.
The activity list would contain the entire scope. Generally, the scope of work that needs to be completed is broken into more manageable phases (releases and iterations). Each phase will have its own Precedence Diagram (Project Network Diagram). Prioritizing scope that provides maximum value is important. Read the Scope Prioritization Using Risk and Value article for more information .
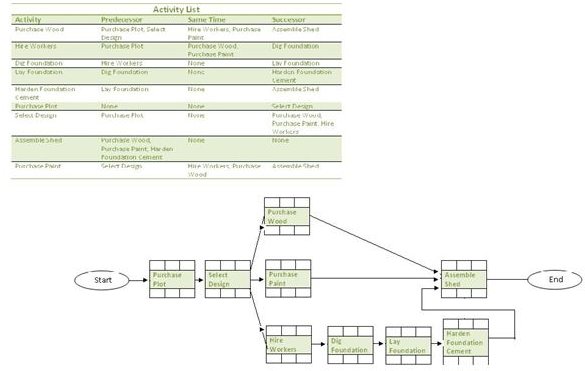
Arrange Project Activities in Order of Execution to create a Precedence Diagram
After creating the table, you can then proceed to constructing the Precedence Diagram (Project Network Diagram). An example precedence diagram is shown in the image. Refer to the table, while creating the project network diagram. The visual representation helps you to identify missing activities. In this example, “Cut Wood” may be a missing activity, that’ll depend on “Hire Workers.” Can you spot any other missing activities?
Usually, there are multiple paths of completion for any project, hence the Precedence Diagram may vary. For example, in the example shown in the image, we could make Purchase Paint dependent on Purchasing Wood. This would alter the precedence diagram and consequently the project schedule.
Important: You need to also be aware of Leads and Lags between activities. Read the Examples of Leads and Lags article.
Tools Used to Create a Precedence Diagram
In a complex project, you will probably not create the Precedence Diagram (Project Network Diagram) manually as we have done in this example. You will most likely use software, such as PS8, to create the Precedence Diagram. However, even in the software, you will need to manually enter the project activities list and the dependencies between them. The software you use, such as PS8 or Microsoft Project , will consist of a gamut of other useful features, like automatically creating the critical path and a Gantt chart .
Another approach to creating a Project Network Diagram used often in teams involves writing project activities on stickies and then sticking them on a whiteboard. You will then manually draw the relationship between the project activities. The advantages of using this approach are:
- The Project Network Diagram can be created with inputs from several people at the same time.
- High visibility thanks to the whiteboards.
- Quick modification because stickies can be placed anywhere and arrows can be erased easily.
After creating a Network Diagram, you will need to use the Critical Path Method (CPM) to determine:
- the critical path diagram (project activities that can cause delay),
- the Float for each activity ,
- the optimal project activity flow, and
- create a schedule.
For more information, see the Using the Critical Path Method article.


