The most basic type of control chart, the individuals chart, is often used for all types of data. Yet often more specialized types of control charts can provide more valuable information about process performance, data variation, and process changes. Learn the different types and when to use them.
About control chart types
In addition to the individual charts , a variety of specialty control charts are at your disposal for charting your data, calculating statistical control limits and detecting special causes. Many of these charts can look very similar to individuals charts, but the limits are calculated differently and do a better job of detecting special causes for the specific type of data for which they are designed.
Software programs such as Minitab and QI Macros for Excel can create any type of control chart and provide settings that can be adjusted by advanced users.
P & np charts
For discrete-attribute data, p-charts and np-charts are ideal. Attribute data is for measures that categorize or bucket items, so that a proportion of items in a certain category can be calculated. Thus a p-chart is used when a control chart of these proportions is desired.
An np-chart is appropriate when the number of items used to calculate each proportion is the same. For example, 100 reports may be reviewed each week and categorized as either accurate or inaccurate. The proportion of inaccurate reports could be plotted on a p-chart or the actual number of inaccurate reports could be plotted on an np-chart. If the number of reports reviewed each week varies, then a p-chart must be used.
C & u charts
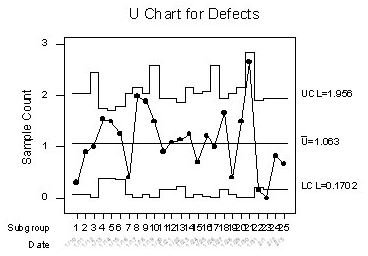
Discrete-count data differs from attribute data in that the occurrence of a characteristic or event can be counted, but a non-occurrence can not be counted. Thus the data plotted for a c-chart or u-chart is always the count of occurrences. The c-chart is used when the opportunity for occurrences is equal for each data point and the u-chart is required when the opportunities differ.
The u-chart looks different from the individuals chart in that the limits actually vary from point to point, as seen here:
Other types of charts
Several other types of control charts are available for advanced Six Sigma practitioners, typically Black Belts and Master Black Belts. These include:
- X-bar, R charts
- EWMA charts
- P charts for data that is not time-ordered
Selecting the correct control chart for your data will allow you to obtain the greatest insight into your process performance and special causes.
This post is part of the series: Types of Control Charts
Control charts are a powerful tool for Six Sigma projects, allowing analysis of special cause and common cause process variation. Learn about the different types and their uses.


