The PICK Chart is a Six Sigma tool that was designed by Lockheed Martin. The tool was developed for managing process enhancement ideas and classifying them during the Identify and Prioritize Opportunity Phase of a Six Sigma project.
Identify the Payoff
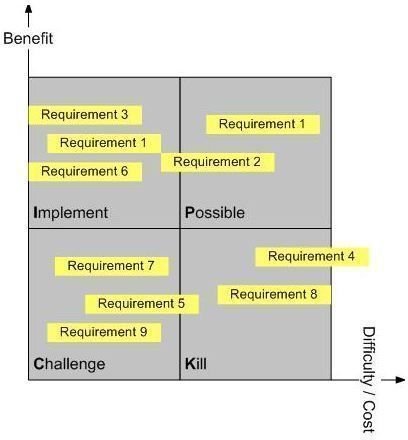
A PICK Chart is used when a team is faced with multiple improvement ideas. The tool helps solve such issues related to deciding which ideas should be implemented. There are four categories on a 2 x 2 matrix. On the scale, the horizontal axis has the scale of payoff or benefits and the vertical axis shows ease of implementation. Next, the decision needs to be taken about where the idea falls on the PICK Chart by categorizing ideas under actions such as Possible, Implement, Challenge, and Kill. The actions are classified as:
- Low payoff, easy to do – Possible
- High payoff, easy to do – Implement
- High payoff, hard to do – Challenge
- Low payoff, hard to do – Kill
The vertical axis represents ease of implementation that would include an assessment of cost to implement as well. The more expensive actions are more difficult to implement. For a look at sample PICK Chart templates, refer to this article containing links to downloadable Six Sigma templates .
Working Through the Data
The PICK Chart tool is used when evaluating pre-process unprocessed data. The method enables the user to reduce huge amounts of raw data to get to the base problem. The PICK Chart is most frequently used during the pre-processing phase of Six Sigma after the data collection stage.
There are numerous techniques to process data. One of the ways is to focus on a sample and condense the information for a particular purpose. The process starts by assessing customer feedback. The data are broken down into the needs and this is often known as pre-processing.
The step mainly includes analyzing consumer responses and extracting key phrases to verify the needs and their context. The records are kept systematically and highlighted in different colors as per needs and context to ensure traceability to their unique starting place. This will help in organizing the data for further characterization.
After the completion of the stage, if there is still a lot of data left, it may be compulsory to cut the data further while maintaining an appropriate representative sample. This helps save energy and time in the long run.
The steps that need to be followed to create a PICK Chart are:
Step 1: On a chart, place the subject question. The question needs to be asked and answered by the team at different stages to be sure that the data that are collected are relevant.
Step 2: Put each component of the data on a different note like a post-it or small cards. These notes should be arranged on the left side of the chart.
Step 3: Each team member must read all notes individually and consider their importance. The team member should decide whether each element should or should not remain a fraction of the significant sample. The notes are then removed and moved to the other side of the chart. Now, the data is condensed enough to be processed for a particular purpose by means of tools like Net-Touch, Affinity Diagrams , or KJ Analysis.
In the Net-Touch, all team members hold on to their own notes and watch the mediator for prompts or signals to offer a note for alliance. A realistic example of the tool is during the construction of an interview conversation guide:
- All team members write open-ended questions that are addressed to the learning objectives.
- All team members have their own notes.
- The mediator randomly picks one note from the group.
- After the note is read, the mediator asks the group if anyone has a query that belongs with the one just read.
- Since all team members are familiar with their own notes, efficiency is provided.
- The mediator collects all notes that are offered and forms a cluster with the original note.
- The step is repeated until all notes have set themselves in the cluster.
- These large clusters are subdivided in small groups and have titles.
The Affinity diagram asks team members to self-stick notes on the wall. Each note is then read by enough team members of the team. The grouping process is then begun.
The KJ Analysis can be carried out in different ways. The common element in all KJ Analysis is that it seeks proof that answers the subject question. Thus, the method is not used when there is a need for brainstorming .


