Many parametric tests used in Six Sigma, such as ANOVA and regression, entail an assumption of homoscedasticity or equal variances. If variances among different groups differ, the chance of reaching incorrect conclusions about the data increases.
Equal Variances
“Homoscedacity” is actually a fancy way of saying that variances are equal. If you are conducting statistical tests as part of your data analysis for a Six Sigma project, you need to be aware that many of these tests require that the variances of different groups being compared be equal.
For instance, suppose you are running an Analysis of Variance test (ANOVA) on data that compares handle times for a specific type of customer call for three different groups of agents. You want to know if the call times are higher for any of the agent groups, indicating an opportunity for process improvement. The raw data comprise a set of call times for each call, along with the agent group that took the call.
The ANOVA will compare the variance within each group, with the variance among the groups to determine if any group differs from at least one other group. For this determination to be valid, the variances of the data for each of the three groups must be equal, within the limits of random variation. In other words, if there is a difference among the groups, it must affect only the mean and not the data variation, or else the ANOVA will not produce the proper conclusion.
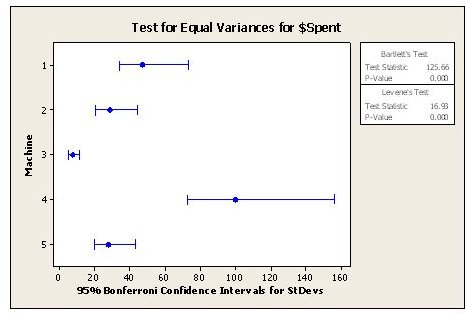
Often a statistical program such as Minitab will conduct a test of equal variance as part of an ANOVA. Minitab currently does both Bartlett’s and Levene’s tests. If your software does not include such a test when you run an ANOVA, be sure to run one on your own and review the results.
So what happens if the variances are not equal? The ANOVA will return a result indicating that there is a difference among groups, when there actually is not, at a rate higher than would normally be the case. That means your chance of type 1 error or a false positive is inflated.
For example, Professor John McDonald at the University of Delaware ran simulations that showed that in some conditions, at a p-level of .05, the ANOVA for three populations that do not actually vary indicated a difference among groups 18 percent of the time when sample variances are unequal, rather than the 5 percent of the time that corresponds to the .05 alpha level. In other cases, the results do not vary greatly from the results obtained when variances are the same.
If you find that your data does not meet the assumption of homoscedasticity (meaning that it instead shows heteroscedasticity), consider transforming your data or using a test that does not have this assumption. Another option is to use this McDonald’s simulator of one-way anova with heteroscedasticity , which lets you run simulations to determine if the false positive rate is substantially inflated. If it is near .05, the unequal variances probably do not limit the applicability of the conclusions you reach based on the ANOVA results.
Resources:
Handbook of Biological Statistics, John H McDonald , Homoscedasticity and Heteroscedasticity.


