Lessen the difficulty of making decisions by using this template. This tool allows you to weigh probabilities and impacts using a step-by-step analysis of the critical points. Our article furnishes guidelines on how to use the free template, downloadable at Bright Hubs Media Gallery.
Some Quick Tips
Through a case study scenario, this article illustrates the use of a decision tree template that is presented by way of a step-by-step procedure in making an analysis of one’s choices.The following sections show three stages by which the tree chart is accomplished during decision-making.
Our case study is where the considerations to hire one of three types of subcontractors are evaluated as to cost and timeliness. We assume the role of a main contractor of a building renovation project, wherein our firm always makes it a point to minimize the costs.
However, the next project in line involves a client who imposes a penalty of one thousand dollars ($1,000) reduction against the contract price for every day of delay.
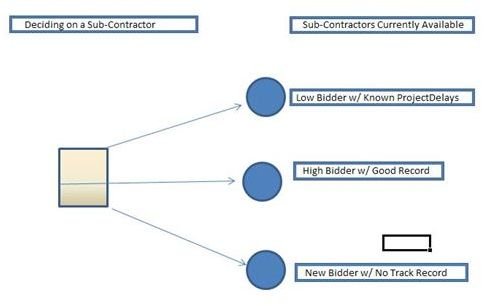
Stage 1: Charting the SubContractors Currently Available
Please click on the screen-shot image on your left and study how we commenced with our decision tree analysis.
-
Low Bidder with Known Project Delays – Bid Price is for $50,000. Although we hired this subcontractor previously, we were able to gather feedback regarding his performance from other building contractors.. Two of the feedback providers disclosed that their projects recently experienced more than one month’s delay of completion . We further gathered that the delays were due to the subcontractor’s shortage in manpower, since his workers tend to abandon his project for other project employers with higher pay-rate offers.
-
High Bidder with Good Record – Bid Price is for $80,000. This subcontractor has not been hired in any of our past projects but was always included as an option because of his good track record. Cost was always a big factor in our previous decisions, but this time, we have to take into consideration the penalty for every day of delay that a subcontracted job may cost us.
-
New Bidder with No Track Record – Bid Price is for $65,000. We are also considering this start-up subcontractor because of his personal experience as a retired electrical engineer from a reputable engineering firm. However, we were not able to gather any feedback for work experience that pertains to large construction projects; hence, we are unable to gauge his reputation for similar conditions.
Stage 2: Analyzing the Potential Risks in Delay and Their Related Costs
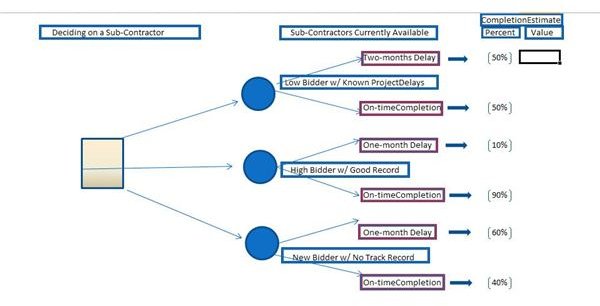
After charting our options, we branched out two types of scenarios for each subcontractor . Our aim is to analyze the probability of the potential risks and establish how much it will cost our company if the probable delays in completion occur. Study the image of our decision tree in this stage, and take note of the additional input.
-
Low Bidder with Known Project Delays – It appears that the low bid being offered is made possible by paying workers at less than the minimum wages. Since this happened only recently, and more on-going large construction projects are about to take place within the vicinity, there’s a 50% probability that worker-turnover will cause our project at least two months’ delay if we hire this subcontractor for our current project.
Advertisement -
High Bidder with Good Record – This subcontractor is aware that his price is generally high if compared to the other offers, hence, he makes it a point to complete the project on time. We can therefore surmise that the risk of delay is low, at 0% - 10% probability. His reputation is his main selling point based on all feedback gathered. Albeit few, all previous hirers had good words for this subcontractor for both quality and timeliness aspects. Nevertheless, we conservatively anticipate at least one month’s delay in the event that unforeseen circumstances could cause delays.
-
New Bidder with No Track Record –We deem this subcontractor’s offer as competitive, and that his capability is backed by solid work experience. We are also contemplating his services but with a 60% probability that he may encounter at least a one-month backlog, due to lack of experience in handling large construction projects.
Stage 3: Quantifying Risks Based on Projected Costs with Consideration for Probable Delays
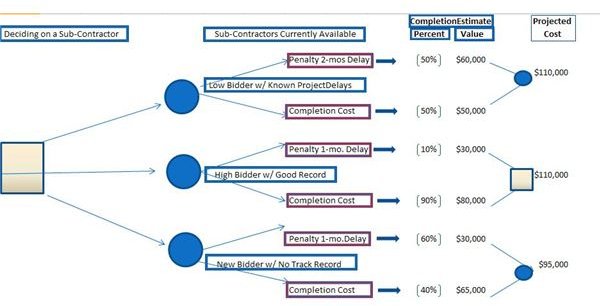
Click on the screenshot and view the completed decision tree. We have quantified the risks by estimating the penalty we will pay in accordance with their related risk probability . The circle denotes that the corresponding subcontractor remains as an option. The square indicates that we have decided to hire this subcontractor, based on the following premises:
-
Low Bidder with Known Project Delays – Our computation of the projected costs, even if the two-month delay takes place, would be the same as that of the highest bidder at $110,000. This may seem reasonable in terms of costs, but the risk of tarnishing our own reputation to deliver on time is too high. The value of the estimated delay was computed by way of this equation: (2 months x 30 days) x $1,000.
-
High Bidder with Good Record – Our projected costs for this subcontractor amounts to $110,000, wherein we took into consideration that the project could encounter delays in completion for at least one month. A similar equation: (1 month x 30 days) x $1,000 was used to compute for the value of the delay.
However, the probability that such a delay will take place is low, if we bank on the subcontractor’s careful regard for his reputation. In all probability, our projected costs will stay at $80,000, if we are to base our decision on the subcontractor’s clean slate. This stands opposed to the results of our analysis for the low bidder, wherein the projected cost of $110,000 is highly possible, coupled with the risk of damaging our reputation. .
- New Bidder with No Track Record –This subcontractor may also be considered as a likely choice if we base our decision on the projected costs of $95,000, which took into consideration the risk of a one-month delay. Still, the risks involved and their negative impact are too high for comfort, due to the subcontractor’s inexperience in handling large construction projects.
The Decision Tree Template
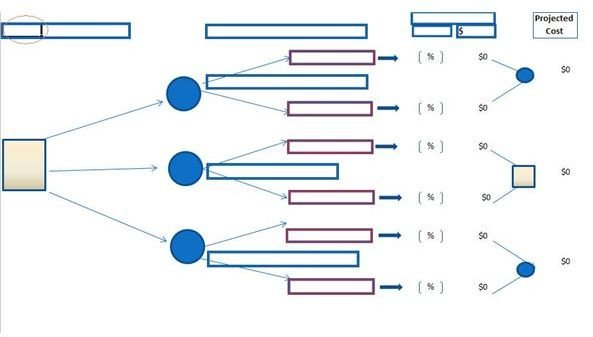
Download this free decision tree template in Excel format at Bright Hub’s Media Gallery . The screenshot on your left shows the completed template, without the inputs used for the case study above.
For the benefit of those who are not too familiar with Excel functions, you can modify the tree chart by :
- Making sure that the cursor, and not the shape-frame adjuster, appears on the desired cell, when typing inputs.
- Using the formula bar for typing data.
- Taking note that the corresponding cells for the “Projected Costs” automatically compute the total of the values under Column L.
- Saving the edits made in the decision tree template.
Reference and Image Credit Section:
- Case study example and screenshot images of the free decision tree template was created for this article by author c.s.cantoria.


