Perhaps decades ago, products were invented and designed by experts with a plethora of knowledge behind them. Product developers provided written guidelines followed by production lines.Today, products and outcomes are often predictable by using effective quality management tools.
The Tools You Need
Your project management peers who toss around words like Pareto charts, fishbone charts, histograms, and scatter diagrams might sound Greek to you, however, for your quality management process to work, you need these tools.
To put these tools in perspective, they are used to improve quality in projects, products, and processes. Some quality management tools help identify problems or processes and provide a way to analyze negativity or ineffectiveness. Others are used to prioritize, and some list causes and effects of elements in a project or process that will affect outcomes.
How do these tools work together and when should they be implemented? Who should run the show, who will analyze and who will implement changes? All of these questions are important for your quality management process to be effective. Project managers need to assign teams and be proactive about good team communication for quality management to run smoothly.
Using the Tools Effectively
Quality management includes planning, processes, and acceptable, organized outcomes. Quality management tools and some useful steps to follow are:
-
Project Planning – Here you should create a project checklist as well as a project control process. Team members can use this planning phase to identify possible conflicts, changes, or risks associated with the project and, at this stage, should write the project scope.
-
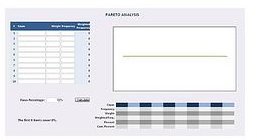
Pareto Charts – A Pareto chart is an easy way to identify tasks within the project and prioritize their importance. The final goal of the Pareto chart is to determine where to maximize efforts to obtain maximum results.
-
Fishbone Charts – The fishbone chart identifies faults or problems in the process or project. It is often used as a graphic demonstration to identify problems, their causes and effect.
-
Histogram – This bar chart includes project variables and identifies root problems. It can also provide a glimpse of where problems lie in relation to the entire project, or on how large scale they appear.
-
Charts and Graphs – Visual components are often the best way to understand your quality management process to see how well it functions initially and throughout the project, and to evaluate project outcomes.
If quality in any project is not considered or analyzed, outcomes could be problematic, inefficient or incorrect. By using quality management tools, you’ll have better outcomes with fewer delays.
Read More About It
At Bright Hub PM, you’ll find informational articles on how to implement quality management as well as articles on some of the tools of quality management including:
A Summary of PMBOK - Quality Management by Ronda Bowen.
How to Write a Scope Statement by Eric Stallworth
When to Use a Pareto Chart by Ronda Bowen
Performing a Cause and Effect Analysis by Michele McDonough
Understanding Histograms by Ciel S. Cantoria
Learn more about Quality Management by enrolling in Essential Skills for Managing Projects , an e-seminar offered by the Project Management Institute.


