
Unless the TQM effect on profitability and productivity is properly analyzed, the management approach cannot be developed properly. TQM is not a new concept, but its application has begun recently in the last decades.
The Management Approach
Total quality management (TQM) is basically the management approach used to improve organization quality and production, especially
business. Analysts examine the TQM effect on profitability and productivity on an organization and develop the corresponding management strategy. TQM is a widespread organization methodology that is applied horizontally in all directions. It involves all employees and their departments, suppliers, customers, and clients. TQM is merely one of the numerous acronyms that are used to identify managing systems that concentrate on quality. Other acronyms being used to illustrate analogous quality management systems are continuous quality improvement, quality function deployment, statistical quality control, quality in daily work, and total quality control. Total Quality Management originated during the early 1950s and has gradually become more accepted since the late 1980s.
Methodology
The TQM methodology involves execution of the following:
- Provide quality.
- Quantify client requirements.
- Produce incentives associated with goals related to quality.
- Develop efficient measures related to service and product quality.
- Promote leading by example.
- Educate workforce to utilize new advanced technology and professional processes.
- Design services and products to meet the quality requirements most cost effectively.
- Recognize existing and upcoming customer requirements.
- Encourage a zero-defect culture in all activities.
- Acquire efficient feedback mechanisms that ensure continual perfection.
General Uses
TQM increases profits by concentrating on quality advancement and focuses on related challenges. TQM is used for:
- Increase in production.
- Reduced rework and scrap.
- Improved production consistency.
- Reduced client service issues.
- Increased advantage in competition.
Quality Tools
The major tools used for TQM are:
-
Discover root causes of the problem.
-
Develop flowcharts that consist of boxes, connected with arrows to permit examination of activities to detect sources of error, or identify areas that need improvement.
-
Fishbone or Ishikawa diagrams have a fishbone pattern. These diagrams are used for the identification of causes, and their effects on processes or products.
-
Run charts are a graph for plotting of data or changes with time.
Advertisement -
Histograms are graphs that display data.
-
Pareto charts are basically a histogram, plotted with the frequency of occurrence.
-
Checklists are used to detect occurrence, frequency, etc., in according with pre-prepared points.
-
Control charts are used to determine the performance pattern and measure the deviation from standard.
-
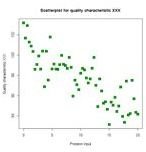
Scatter diagram is a graph that plots two variables, which create an indication of the correlation between them.
-
Checklists and flowcharts are used as important quality tools in management, while fishbone diagrams are normally used in the disciplines of engineering and production.
British Telecommunications Case Study
British Telecommunications impressed the business community because of its quality management system started during 1986, due to which the organization’s growth was thereafter rapid. The TQM effect on profitability and productivity were becoming visible in BT after the application of modern tools of TQM. BT is a member of the British Quality Foundation and European Foundation for Quality Management. It enjoys respect and reputation in the arena of quality, due to dedication to TQM, and has obtained several rewards due to quality standards. Quality approach is reflected in the quality policy that includes guidelines concerning quality management systems, excellence in business and recognition, and other important aspects concerning quality.
References
- Nova South Eastern University on Basics of Total Quality Management
- CEECIS on TQM effects on productivity and profitability
Image credits: freedigitalphotos.net/renjithkrishnan; commons.wikimedia.org/DanielPenfield


