Illustrated in this article is a sample of a decision making tree. It helps in calculating the probability of an event in numerical terms based on diagrammatic or graphical representation.
Decision Tree Analysis / Impact Analysis
One of the best ways to explain the probability and impact correlation of a risk assessment would be to illustrate with a sample of a decision making tree. The decision making tree follows what is known as decision tree analysis or impact analysis and reflects decisions made based on a sequence of events or several interrelated decisions.
Impact trees or decision trees contain points or nodes in diagram form known as decision points and chance points. Technically speaking, decision points are illustrated by a box and chance points by circles. Using this as a guide, chance points and decision points may be plotted in a sequence that leads to decision making. It follows a tree pattern with branches extending from the initial need for decision.
Creating a Log Tree to Help with Decision Making
- Logic trees are made from left to right with inclusions of chance and decision points.
- Branches indicate probabilities
- Probabilities are indicated in numerical values such as percentages
- Combined value at nodes equals 1
- In making a positive decision or a go-ahead, multiply positive considerations along a branch from the initial node; calculations made for both branches
- Add conditional payoffs that arise from the initial node to complete the decision tree.
Decision Making Tree Diagram
Example of Impact Analysis / Decision Tree Analysis
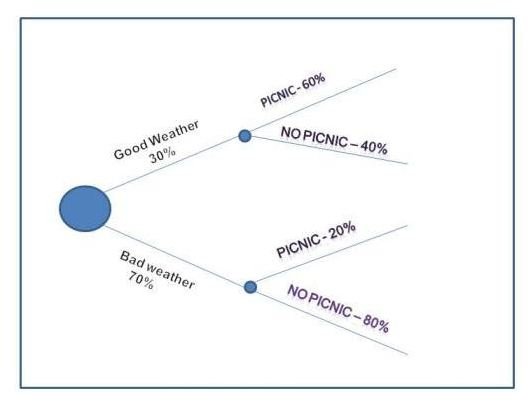
Illustrated above is a sample of a decision making tree. Let us assume that a office picnic is being planned and is dependent on the weather. The condition for deciding on the picnic, or the probability of having the picnic should value 0.65 / 1 or 65% for the picnic to be held. If the value is less that 65%, a decision not to have the picnic is taken.
In this illustration, assume that from data obtained from external sources, there is a 30% chance of good weather and 70% chance of bad weather.
In good weather, there is a 60% chance that the picnic will be held and a 40% chance that the picnic will not be held. In bad weather there is a 20% chance the picnic will be held and an 80% chance the picnic will not be held.
In order to come to a decision, the probability of the entire tree will have to be calculated, and if the value is 0.65 or above, then a picnic will be decided upon. If criteria are not met, there will be no picnic.
Probability of Having an Office Picnic
= probability of an office picnic in good weather + probability of an office picnic in bad weather
= [0.30 x 0.60] + [0.70 x 0.20]
= 0.18 + 0.14
=0.32
= 32% chance of having a picnic.
Since the criteria required for having a picnic is a minimum of 65%, it can easily be assumed that no picnic will be held.
Conclusion
It can easily be seen that the probability of an outcome can be calculated when using the decision making tree diagram in project management . It is easy to follow and the impact is obtained in numerical values which help in decision values rather than assumptions.
* Image Credit: Diagram created by Amanda Dcosta
This post is part of the series: Risk Management
Risk Management is an area of expertise that every project manager should be trained in. It takes a project manager through the process of first identifying and assessing risks in a project. When identifying and assessing risks, many tools and techniques have to be used.


