A fishbone or Ishikawa diagram is used to organize potential root causes of a problem and to help get at root causes. You can create one on a whiteboard or with specialized or basic software. In either case these tips will help you create your cause-and-effect diagram effectively.
About Fishbone Diagrams
An Ishikawa diagram is referred to as a fishbone diagram due to its resemblance to a fish skeleton, with bones emanating from a central bone. Because it is used to analyze potential causes for an effect, it is also known as a cause-and-effect diagram. These tools are commonly used during the Analyze phase of a Six Sigma DMAIC project , as the goal of this step is to identify root causes for the process problem that is the focus of the improvement effort. In Six Sigma, analysis of root causes consists of two main components: brainstorming potential root causes and then validating with data which are in fact actual root causes.
Typically the participants in the exercise of creating a fishbone include both Six Sigma project team members and individuals who perform the process that is the subject of the project . Both groups provide valuable insights regarding the potential root causes of a problem and the questions that should be asked to dig down to root causes.
Creating A Fishbone Diagram
Bring together the appropriate people and set expectations regarding creation of the cause-and-effect diagram. As in all brainstorming exercises, participants should be encouraged to voice any ideas they have regarding possible causes of the problem, and others should withhold judgment until the next step in the process when potential root causes are evaluated and validated.
Some teams like to first use the “5 Whys ” technique to generate potential causes, and then organize them using the fishbone. Others like to fill in the fishbone diagram as they are generating ideas. For this exercise we will focus on using the fishbone from the beginning both for listing potential causes and for organizing them.
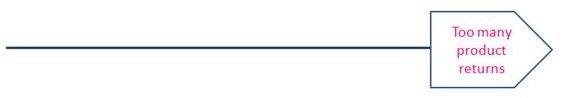
Start the exercise by drawing the head of the fish and the main bone. Inside or next to the head of the fish, write a brief phrase that describes the problem for which causes are being suggested. For instance, the phrase might be “37% of products are returned” or “customer does not complete online order process” for an online product sales company.
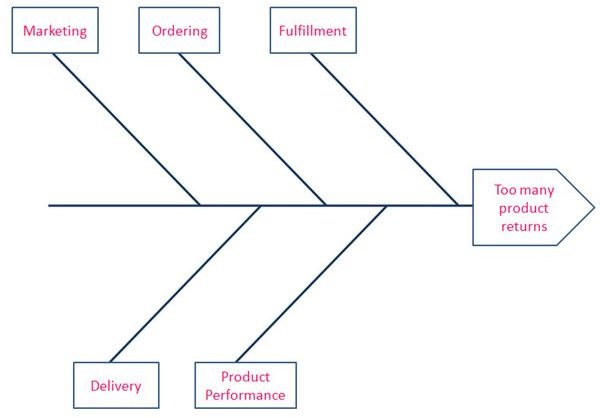
Next draw several lines coming off of the main bone, at an angle like fish bones. Break your process down into separate stages and use those stages to label the main bones. For instance, you might have bones for the Marketing , Ordering, Fulfillment, Delivery and Product Performance stages of the process. If you prefer, you can instead label each of the main bones according to any basic categories which are relevant for your process and problem, such as Technology, Communication, Policies and Defects .
Now comes the real work of creating a fishbone. Participants will begin brainstorming reasons why the problem described by the phrase in the fish head is occurring, prompted by the facilitator asking, “What are some possible reasons why X might be occurring?” For each potential cause, a bone is added to the appropriate main bone. It usually works best if people can toss out ideas in any category as soon as they think of them, which requires that the scribe quickly determine which main bone it fits on so it can be added in the appropriate place. In some cases the facilitator may prefer to have participants talk through one category or process phase at a time, to make it easier to properly track all the suggestions. In either case, the initial responses are drawn onto the appropriate main bone.
The next step is to drill down for each of the potential causes to the root causes. For instance, it is not enough to say that a product was returned because the customer received the wrong product. The group needs to then ask why the customer received the wrong product. Possible reasons include a technological glitch in the ordering process, an error in the fulfillment process, or even that the customer misunderstood the product description. Each of these should be listed separately on the fishbone diagram. In fact, as our example illustrates, it is sometimes obvious when a possible cause needs to be probed further when it could fit in many categories or many phases of the process . The technology glitch would be added to the Ordering bone, whereas the fulfillment error would go on the Fulfillment bone.
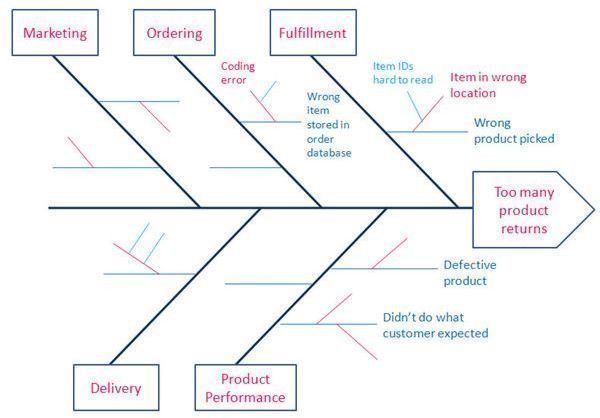
For each potential cause, keep asking “why” and adding additional bones at additional levels until it no longer makes sense to ask “why”. Many examples of fishbones show only a couple levels, but expect to have at least three levels if you are effectively drilling down to root causes, and in a few cases perhaps even more levels. Note that some main bones may have many smaller bones or many levels, while others may have fewer second-level bones or fewer levels. For fishbones with more than two levels, color-coding the bones by level can increase readability.
Once your fishbone is complete, the Black Belt or Green Belt leading the project will then guide the team through evaluating the potential root causes that the group came up with and determine which will be validated with data.


