The box-and-whiskers plot, or box plot, is a statistical analysis tool. This visual display of a set of data provides information about the variation within the data. It is a popular tool for Six Sigma data analysis in DMAIC projects.
Analyzing Stats with Box-and-Whiskers Plots
In the Measure phase of a DMAIC project , the objective is to get a detailed understanding of the process performance problem being addressed. Data is collected on the measure under investigation along with data on factors believed to affect this performance metric. In the Analyze phase, the objective is to identify root causes of the process performance problem being addressed. Brainstorming techniques are used to generate a list of potential root causes, and then data is collected to validate those considered likely candidates.
The box-and-whiskers plot, also referred to as simply the box plot, is one of the statistical tools used for Six Sigma data analysis in these situations. It is appropriate when the input variable is a discrete categorical variable and the output variable is a continuous variable. For instance, the input variable or category factor could represent different teams performing the same function. The output variable could represent gross sales or amount of product created.
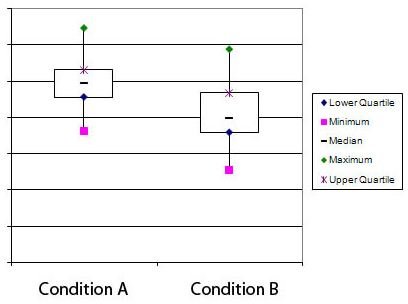
The example shown here illustrates data for two different conditions. The point in the middle of each “box” represents the median of that data set. Sometimes the median is depicted using a line the same width as the box. Exactly half the data points lie above the median and half lie below. The bottom of the box represents the 25th percentile, and the top of the box depicts the 75th percentile. So the first quartile of the data is below the box, the second quartile falls between the bottom of the box and the median point or line, the third quartile falls in the other part of the box, and the fourth quartile lies above the box.
In this example, the upper whisker extends to the maximum data value and the lower whisker extends to the minimum data value. Sometimes the whiskers instead extend only a limited distance beyond the box, and data points beyond the whiskers are indicated with asterisks to designate outliers. Programs such as Minitab are typically used for creating box plots. The user is provided the ability to specify the parameters for the plots, such as the criteria for designating outliers. The user may also have the opportunity to have the plot show the mean in addition to the median.
Several pieces of information can be quickly gleaned from reviewing a box-and-whiskers plot. First, each data set can be viewed independently to assess the mean and median, the amount of variation, and the existence of outliers. More commonly, the plot is used to compare multiple data sets gathered in different conditions. Differences in the height of the box portion, the position of the median and the box, the length of the whiskers, and the characteristics of outliers all convey valuable information about differences in process performance among different conditions. If the boxes for different conditions do not overlap in values at all, chances are a significant difference between the conditions exists. Statistical tests such as analysis of variance (ANOVA) should be used to confirm any conclusions reached from viewing the box plots. In fact Minitab offers the option to display box plots when generating an ANOVA on a data set.
In conjunction with other graphical techniques and data analysis tools, the box-and-whiskers plot provides valuable insight into your Six Sigma project data. It is particularly helpful for illustrating differences (or lack of differences) to business leaders who are not familiar with statistical tools.


