The histogram is an important statistical tool often used in project management. This article will discuss three websites where you can make histograms for free.
The Need for Histograms
In real life, you may sometimes have to deal with large numbers of discrete statistical data. For example, if you collect weight data of thirty different people, you may end up with a collection something like below:
25, 25.5, 27, 28, 29.5, 31, 32, 32.5, 37, 38,38.5, 39,39.5, 41, 44.5, 42, 46, 47.5, 48, 48.5, 50, 50.5, 51.5, 52.5, 53.5, 55.5, 56, 57, 59.5, 60
If you want to plot this kind of data graphically, you have to group the data and plot the data points falling in that group. You may group the data like below:
Weight (Kg) …………………….Frequency
25-30 **……………………………………**5
30-35 **……………………………………**3
35-40 **……………………………………**5
40-45 **……………………………………**3
45-50 **……………………………………**4
50-55 **……………………………………**5
55-60 **……………………………………**4
Now plotting this kind of data you have to use histogram. The following three websites will help you create your histogram if you have your data ready.
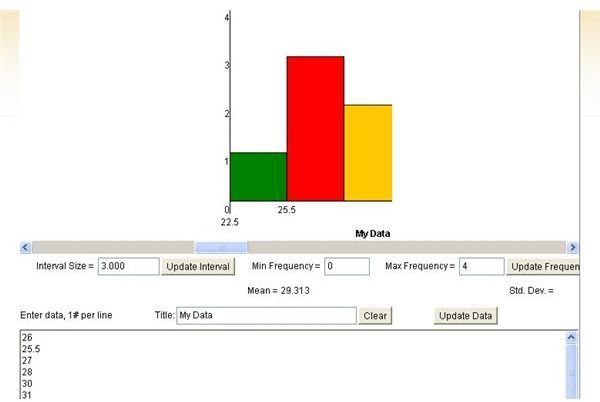
1. Shodor Histogram generator ****: This is one of the best online tools for histogram creation. You need to enter the entire set of data in the required field and then set the interval size.
When done, hit the “Update Data” button and the histogram will be created.
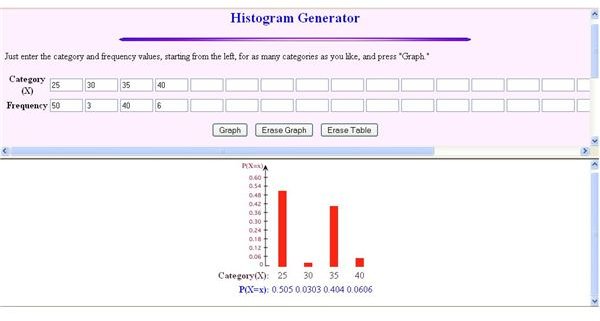
2. Stefan Waner & Steven R. Costenoble Histogram Generator : In this tool, you have to enter the group or category (like, 25-30 or 30-35 in the above example) to the top row and respective frequency values in the bottom row. Once you are done with the data entering, press the “Graph” button and the histogram will be created. You have to scale the frequency value of the graph.
3. Easy Calculation Histogram:
Enter your data into this online Histogram Graphing Calculator.
Conclusion
Histograms can also be created in Microsoft Excel if you have access to this application. There are many websites where you can make a histogram for free but the quality of the generated histogram varies. Check the output before making the decision of which one to use.


