This step-by-step guide describes how to create custom project reports in Microsoft Project. In the first part of this series, we focus on creating a custom report by editing an existing report and on developing a new custom resource report.
Custom Project Reports
Even though Project has more than 25 predefined basic reports (and visual reports), you have the option of creating a custom basic report based on your individual project needs. Custom reports can be summarized by:
1. Task
2. Resource
3. Calendar
4. Crosstab
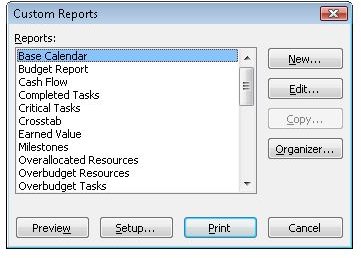
You create custom reports in the Custom Reports dialog box, shown in the first image below. Custom is one of the six categories you see when you open the Reports dialog box (Report menu).
There are many ways to create reports. These are defined in the next several sections.
Also, be sure to check out the other Microsoft Project tutorials available at Bright Hub.
Create a Custom Report by Editing an Existing Report
One way to create a report is to use a report that is already available in Project and then rename and edit it. To create a custom report based on an existing Project report, follow these steps:
- Choose Report, and choose Reports.
- Select Custom, and then click Select.
- To create a task report or resource report, click New in the Custom Reports dialog box, select Task or Resource, and then click OK. You can create a new report or select an existing report and edit it.
- To edit an existing report, click the report that you want in the Reports box and click Edit.
- In the Task Report dialog box, in the Definition tab, type a name for the report in the Name box.
- In the Period drop-down list, select the time period that you want to display.
- In the Count text box, type the number of time periods you want to report. (The Count box is unavailable if you select Entire Project from the Period drop-down list.)
- In the Table drop-down list, select the table that you want to display.
- In the Filter drop-down list, select the filter that you want to apply.
- If desired, select the Highlight check box to show the filtered tasks with different formatting.
- If desired, select the Show Summary Tasks check box to include summary tasks in the report.
- If desired, select the Gray Bands check box to display the report with gray divider lines in the formatting.
- If desired, sort the task or resource data in a report. To do so, click the Sort tab, select the field that you want to sort on in the Sort By drop-down list, and then select Ascending or Descending.
- To sort by the second or third sort criteria, select the field that you want in the appropriate Then By drop-down list, and then select Ascending or Descending.
- Click OK.
Note that the edited report is now available in the Custom Reports dialog box. Click Select to view the report.
Create a New Custom Resource Report
You can also create a new report from scratch. These reports can be Task reports, Resource reports, Monthly Calendar reports, or Crosstab reports. Additionally, you can apply options like showing summary tasks, highlighting filtered data, and applying gray bands to specific data.
To create a new Resource report (creating a new Task report is similar), complete the following steps:
- Choose Report, and choose Reports.
- Select Custom, and then click Select. Click New to create a new report from scratch.
- In the Define New Report dialog box, select Resource. (Note that Task is also an option and is similar to creating a Resource report.) Click OK.
- In the Resource Report dialog box, in the Definition tab, type a name for the report in the Name box.
- In the Period drop-down list, select the time period that you want to display.
- In the Count drop-down list, select the number of time periods you want to report. (The Count box is unavailable if you select Entire Project.)
- In the Table drop-down list, select the table that you want to display.
- In the Filter drop-down list, select the filter that you want to apply.
- Select the Highlight check box to show the filtered tasks with different formatting.
- Select the Show Summary Tasks check box to include summary tasks in the report.
- Select the Gray Bands check box to display the report with gray divider lines in the formatting.
- Click the Sort tab, select the field that you want to sort by in the Sort By drop-down list, and then select Ascending or Descending.
- To sort by the second or third sort criteria, select the field that you want in the appropriate Then By drop-down list, and then select Ascending or Descending.
- Click the Details tab to view details regarding the new report. Note that you can select various check boxes to include Notes, Objects, and other data by selecting it.
- Click Text to display the Text Styles dialog box.
- In the Item To Change drop-down list, select an item.
- Under Font, select a font for this item. Under Font Style, select a style for the item. Under Size, select a size for the item.
- Select the Underline check box to underline the data.
- Select a choice for Color, Background Color, and Background Pattern. Click OK.
- Repeat steps 16 through 20 for any other item to format.
- Click OK.
Note that the edited report is now available in the Custom Reports dialog box.
Excerpted from…
With permission from Microsoft Press, this article content was excerpted from the book, Managing Projects with Microsoft Office Project 2007 (Self-Paced Training Kit for Exam 70-632) .
This post is part of the series: Project 2007: Creating Custom Project Report
A two-part article on creating custom project reports in Microsoft Project 2007.


