When you are focused on getting a project plan in motion, it is easy to lose track of your resources. In this article, you will learn how to use the Resource Availability graphs in Microsoft Project to monitor your resource and their levels of allocations.
Despite their best efforts, project managers will overallocate certain resources accidentally from time to time. A great way to keep tabs on resource utilization is through the Resource Availability graph that Microsoft Project can produce based on your allocation percentages. This bar graph will let you know instantly whether a resource is over, under, or fully allocated, and can help you decide the best way to redistribute and use resources in a convenient and sensible fashion.
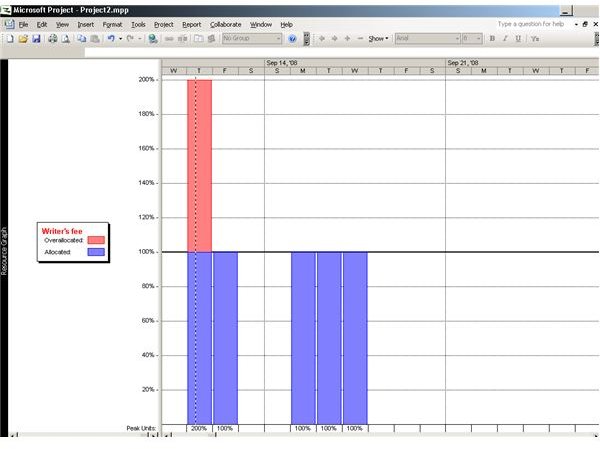
To access your Resource Availability Graph, click on the View menu and select “Resource Graph .” This will list your current resources with an individual bar chart next to each indicating the amount used. The point of the graph is to offer a quick, informative glance at the available resources and budget information and mainly uses color coding to show this. If a resource is written in red font, you know immediately that it is overallocated, and should be reviewed to see where some resource use can be redistributed. If the name is listed in black font you know that they are fully, or underallocated.
In the example below, you can see that on Thursday the resources allocated for writer’s fees was exceeded by 100%, while the other days on the graph use an amount of resources within the limit set on the Resource Sheet.
Note: One thing that is slightly confusing at first is that Microsoft Project puts all of the Resource Availability Graphs on one page, and you need to scroll up and down to see the status of individual resources. When you switch your view to the Resource Availability Graph, you will automatically be focused on the graph of the first resource listed in your Resource Sheet. All other graphs will be listed below this first one in order the resources are placed on your Resource Sheet.
From these graphs, broken down on a resource-by-resource basis, you may both monitor the usage of your resources and plan additional uses for them when creating new tasks. This is one of the easiest functions to access and create in Microsoft Project, and is one of the clearest ways to assess the standing of both your resources and budget.


