Inevitably, all projects face a little turbulence and as Project Manager you need to find the root-cause of issues. Fishbone diagrams, also known as Cause-Effect diagrams, are a useful quality control tool used in Project Quality Management. In this article, fishbone diagram examples are shown.
For Finding Possible Causes
Fishbone diagrams are also known as Cause-Effect and Ishikawa diagrams. They are used to help find the possible causes for a problem that has occurred. As a project manager, you need to be able to not only create a Fishbone, but also interpret it.
How to Create a Fishbone Diagram
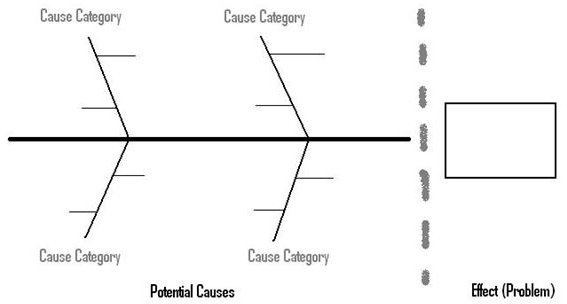
Before we get into the fishbone diagram example, let’s review how to create a fishbone diagram. The image below shows the two sections of a fishbone diagram. As you can see, you have causes on one side that could lead to an effect (problem) on the other side. The causes are categorized and can either be primary or secondary.
To learn to create a fishbone diagram using Microsoft Excel, read the Creating Fishbone Diagrams in Excel 2007 article.
Now, let’s look at some Fishbone diagram examples and see what can be derived from them.
Example 1
In knowledge services, such as IT and Software Engineering, attrition can cause havoc in the project team. The fishbone diagram below illustrates a typical problem faced by a Project Manager whose team is hit by severe attrition. For this reason, a Project Manager needs to have developed appropriate project management soft skills .
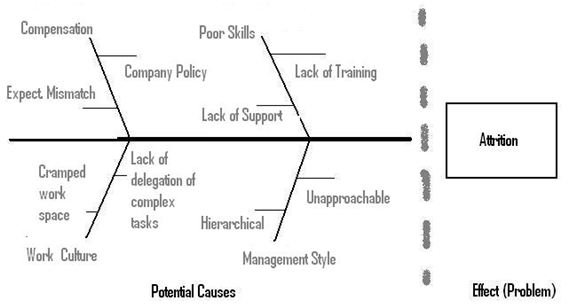
The Fishbone Diagram Example above shows a team hit by attrition. The possible causes are listed. A little investigation will help you determine which cause is most likely causing the attrition (problem). For example, you may carry out a survey to figure out compensation related causes. Or, take a look at your own management styles.
Example 2
Another problem that can cause havoc in Software Development is downtime. This leads to no work being performed and project team members sitting idle. When the downtime is resolved project teams need to either burn the midnight oil to catch up or renegotiate the deadline. Either way, the project manager will need to analyze the impact of the downtime on the critical path of the project .
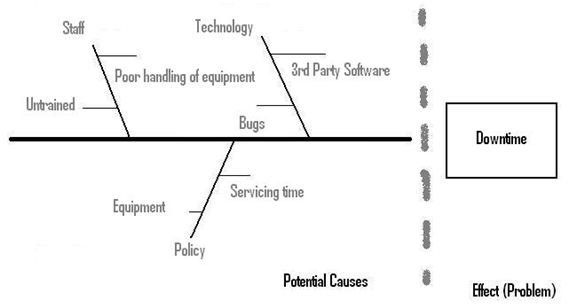
In the Fishbone Diagram Example shown above, a team hit by downtime has several causes that they can further investigate. Some of these causes could be staff training or the use of third-party tools.
Example 3
IT projects are usually geographically dispersed. This means that the design of an application may take place in England and then a part of the implementation in India and another part in Germany. The strides in communication technology have enabled this to happen, and better results are achieved and passed on to the end customer. Miscommunication is a key problem in globally dispersed projects and can lead to significant problems. Read the IT Software Project Management Key Points article for more on challenges faced by geographically dispersed teams.
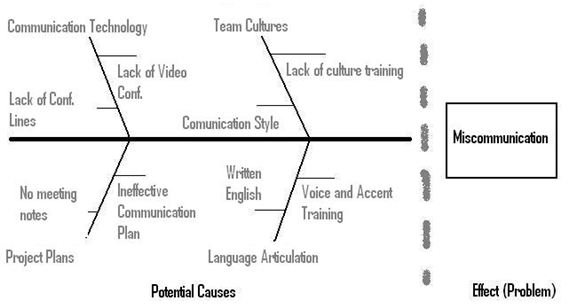
In the Fishbone Diagram Example shown above, the project team is trying to resolve a miscommunication issue. The causes are many and they could be resolved by understanding the relationships involved in the project team. For example, if there are many cultures in the team, then a cross-culture training should go a long way in resolving the issue.


