If for no other reason, the Gantt chart can help your team stay FOCUSED. So ineffective Team Collaboration (ITC) – one of the primary contributors to derailing a project – doesn’t rear it’s ugly head costing you both time and money (but especially money).
Can a simple Gantt chart REALLY improve the batting average of your team?
Consider first the following scenario: You’re about to kick off an important and ambitious project. All the pieces are in order: a seemingly focused team of professionals, coordination and cooperation between manager and client . But as you proceed, the project slowly falls apart. You notice you have a great team of associates but each individual seems to have his or her own ideas of what is best for this project.
Welcome to one of the most prevalent issues among project managers: Ineffective Team Collaboration (ITC) has reared its ugly head again. In fact, ITC is one of the primary contributors to starting over, not to mention IT delivery failure. Both cost time and money. Productive synergy can’t occur if everyone on your team is heading off in their own direction.
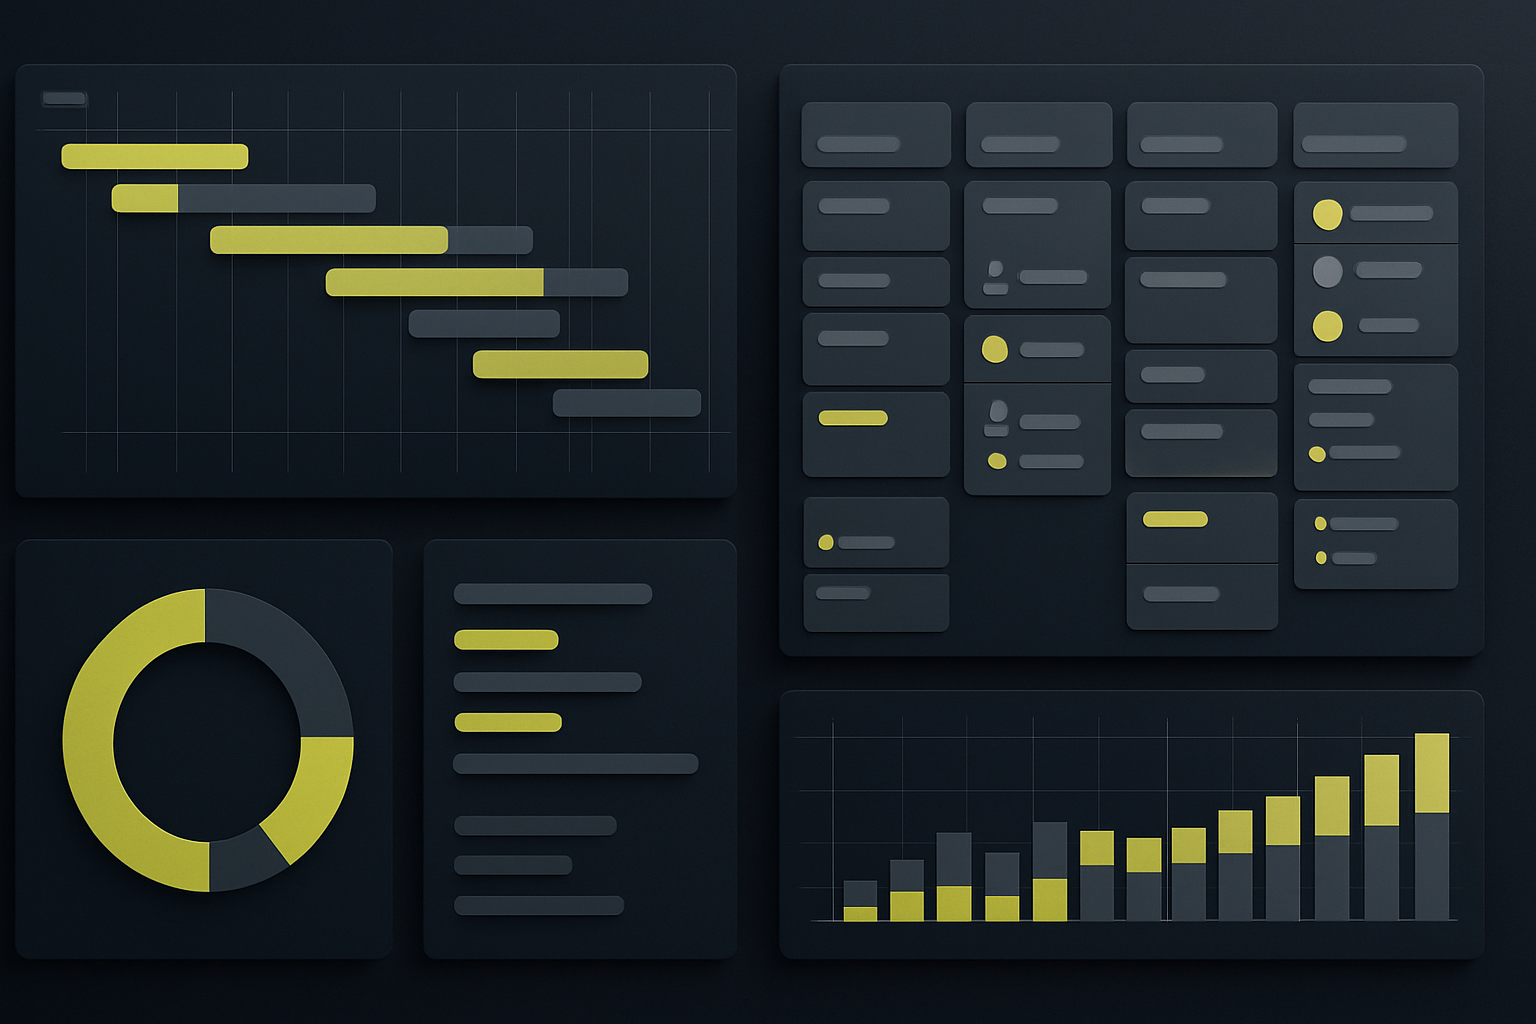
If only you’d been using a Gantt chart all along, maybe this wouldn’t have happened. In its simplest form, the Gantt chart is a graphical representation of task: on one side of the chart you list your tasks. And in the horizontal axis is a time scale, expressed either in absolute or relative time.
When you prepare a Gantt chart, each task is allotted its own row. Dates run along the top identifying days, weeks and/or months. Rows of bars in the Gantt chart show the start and end dates of each task in the project . Let’s face it, in order to find yourself on the winning side of a challenging project, the project manager needs to stay on top of all the nuts and bolts of said project which includes (but is not limited to) estimates of work hours and duration, resource usage, risks and measures of progress.
The Gantt chart won’t solve all your problems, but will sure help you as you progress. Provided you don’t exceed the chart’s strengths while recognizing the chart’s drawbacks.
Thus, you can use Gantt chart at project scheduling stage to:
- Assess time characteristics to a project
- Illustrate the task order
- Specify the resources involved
- Demonstrate and identify the links between scheduled tasks
Let’s review a second:
- Gantt Charts are useful management tools that help you plan and manage both simple and complex projects.
- The Gantt chart will help you break down the task order in the steps in which the tasks need to be carried out , while allowing you to identify the resources needed to complete the project. Additionally, the Gantt chart can identify which resources are needed while assisting you in identifying the quickest possible time in which a project can be completed – via the best “critical path" to be followed. (In other words, the sequence of tasks that must be completed on time so as to not affect the project end date).
Furthermore, once you’re under way, the Gantt chart can assist you in monitoring whether the project is on schedule. So, when a situation arises similar to what I pointed out in the first paragraph, you can rebound from it and press on.
The Gantt chart CAN promote team effectiveness by keeping everyone focused on the job at hand. The chart also sets up lines of clear communication because the critical issues are sitting there looking at you in black and white. You can read more about Gantt charts (and PERT charts) in my article, The Pro’s and Con’s of Using PERT and Gantt Charts .


