Even if you have other PM software at your disposal, you probably use a spreadsheet application like Excel to create various forms and exhibits. To make your job easier, we’ve put together a list of Bright Hub’s most popular Excel tutorials and templates related to project management.
Getting to the Root Cause
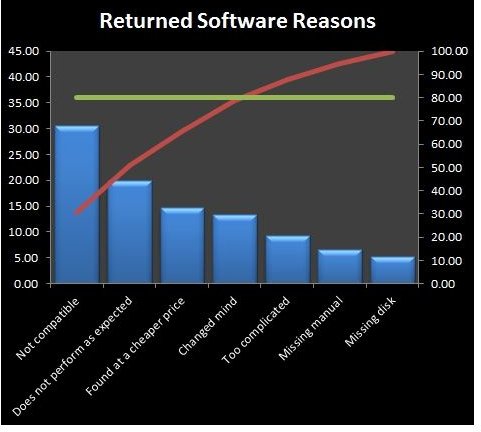
Are you trying to figure out the key factors responsible for causing a specific problem? Project managers apply numerous root cause analysis techniques, and these methods can generate quite a bit of data. Excel is quite useful for sorting and analyzing this data, so you can derive meaningful results.
In addition to the step-by-step tutorials that explain how to perform these analyses, we also have several sample forms and templates that you can download from the Project Management Media Gallery. Feel free to modify these templates so that they’ll be more useful for your particular project.
-
Creating Pareto Charts With Microsoft Excel
Advertisement
Dealing With Schedules
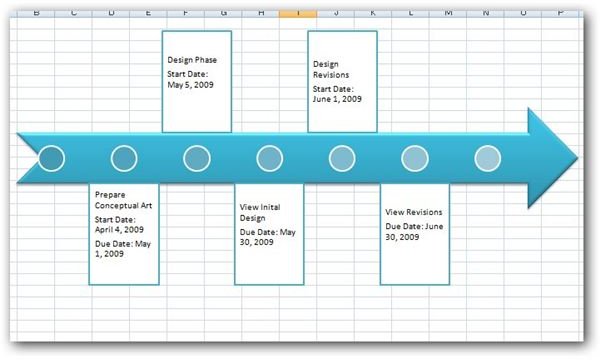
If the project you’re managing is fairly large, Excel is probably not the best choice for a scheduling tool. Still, it can be used to create a high-level breakdown of your project’s main components and key milestones before moving on to develop a more detailed schedule. On the other hand, for small- to medium-sized projects, Excel may be all you need.
Some of these tutorials require Excel 2007 or 2010 if you want to duplicate the results completely, but almost all can be adapted to previous versions of the software if you don’t mind foregoing a few bells and whistles.
Delegation and Creating Status Reports
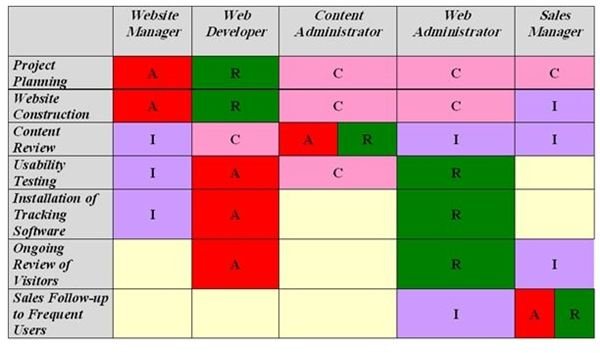
Keeping track of who’s doing what and other related matters can be a daunting task even if your project is fairly small in terms of size and scope. Before you even start to assign tasks, you may want to create a RACI matrix to use as a high level delegation tool. There are several variations of this matrix, all described in the first article linked below.
Although it may not seem like it at the time, the initial assignment of tasks may be the easiest part of the project! Tracking these assignments, noting variances and setbacks, and smoothly transitioning from one phase of the project to another can be a nightmare without the right tools. Regular status reports can help these processes. As mentioned in the scheduling section, Excel may not always be the best tool for this type of tracking, but it can work quite well for certain types of projects.
Creating Six Sigma Charts and Diagrams
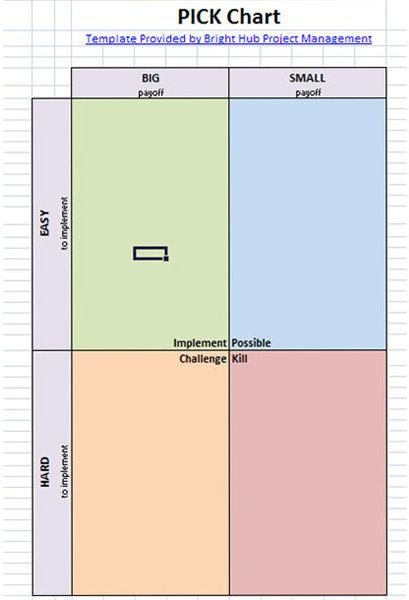
Even if your project isn’t incorporating Six Sigma methodologies, these charts and tutorials may help your team make decisions on certain questions – including whether or not to embark on the project in the first place. So, don’t let the “Six Sigma” designation here run you off.
In fact, PICK charts and SIPOC diagrams are fairly high-level tools for developing ideas and understanding processes that can be used to help nail down the scope in any project, Six Sigma or not.
Assessing and Managing Risks
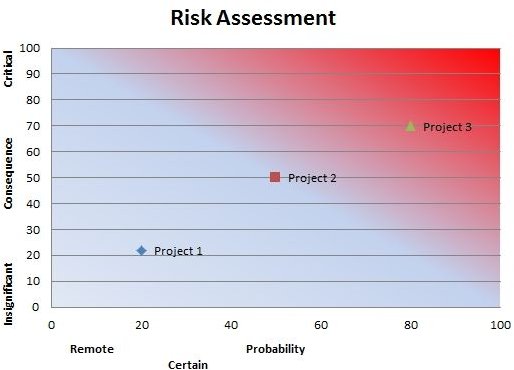
Excel is actually a great tool to use for risk management, no matter how large your project is. For larger projects, you may just want to use the spreadsheet software to help you track the big picture, but you can also make use of more elaborate templates that allow you to track risk throughout the entire project life cycle.
The links below will take you to free, downloadable templates for general risk management tools. You may be able to use them as-is or you may want to modify them to include extra elements and tracking mechanisms.
Working With General Charts and Graphs
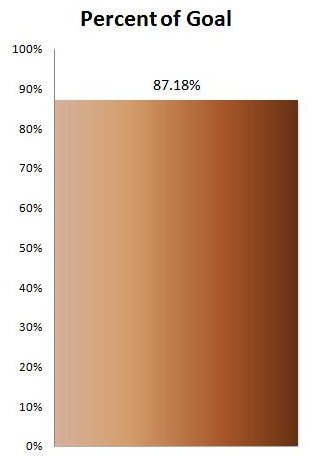
No matter how big your project is, Excel can be extremely useful when you need to produce status reports and project updates for stakeholder meetings. While these tutorials are not really project management specific, they do describe how to create various charts and graphs that project managers make on a regular basis.
Once you create a chart in Excel, you can easily plunk it into a PowerPoint presentation or Word document for easy distribution. If you’re not familiar with that process, we have a tutorial for that, too.
Formatting and Calculation Tips
While many people are fairly comfortable with using Excel as a data entry tool – and even performing basic calculations – they often overlook some of the more powerful functions and features. For instance, did you know that you can add a pop-up picture or a tool tip to a worksheet cell?
At Bright Hub, we have literally hundreds of articles that explore these capabilities, but here are some of my personal favorites (along with a couple of links that will take you to more detailed lists of tutorials).
A Few More Project Specific Templates and Forms
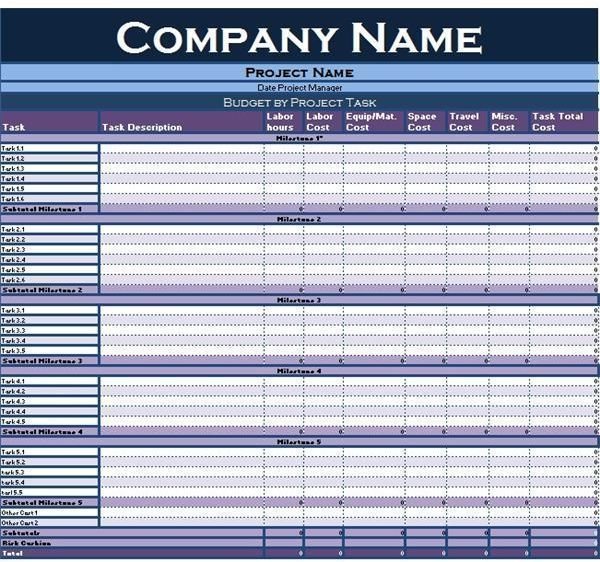
Still haven’t found what you’re looking for? Here are several more Excel templates and tutorials from the Bright Hub’s Project Management channel that didn’t quite fit neatly into any of the above categories.
If nothing here fits the bill, please be sure to leave a note in the Comments section and we’ll see if we can add a new template or point you in the right direction. In addition, new material is added on a regular basis, so bookmark us and keep checking back!
References
- Screenshots taken from templates and forms in Bright Hub’s Project Management Media Gallery.


